📈 Asset Statistics
The Asset Statistics module provides an overview of the platform’s assets under management.
It is designed to help operators and managers monitor and analyze the distribution and composition of assets over time.
By visualizing asset data, the module enables better decision-making, transparency, and reporting to stakeholders.
🔍 What is Asset Statistics?
The Asset Statistics section shows the total cash balance, investment amounts, estimated profits, and how assets are distributed among instruments and providers.
It allows the user to track how assets are allocated and distributed, and how these values change over time.
The Asset Statistics module is divided into two main pages:
🟦 Asset Totals
The Asset Totals page displays the overall asset figures in a visual and interactive format.
A pie chart is used to represent the following components of the total assets:
- Total Cash Balance: The sum of all available cash across the platform.
- Total Investment Amount: The amount currently invested in financial instruments.
- Estimated Profit: The expected profit based on current positions and market values.
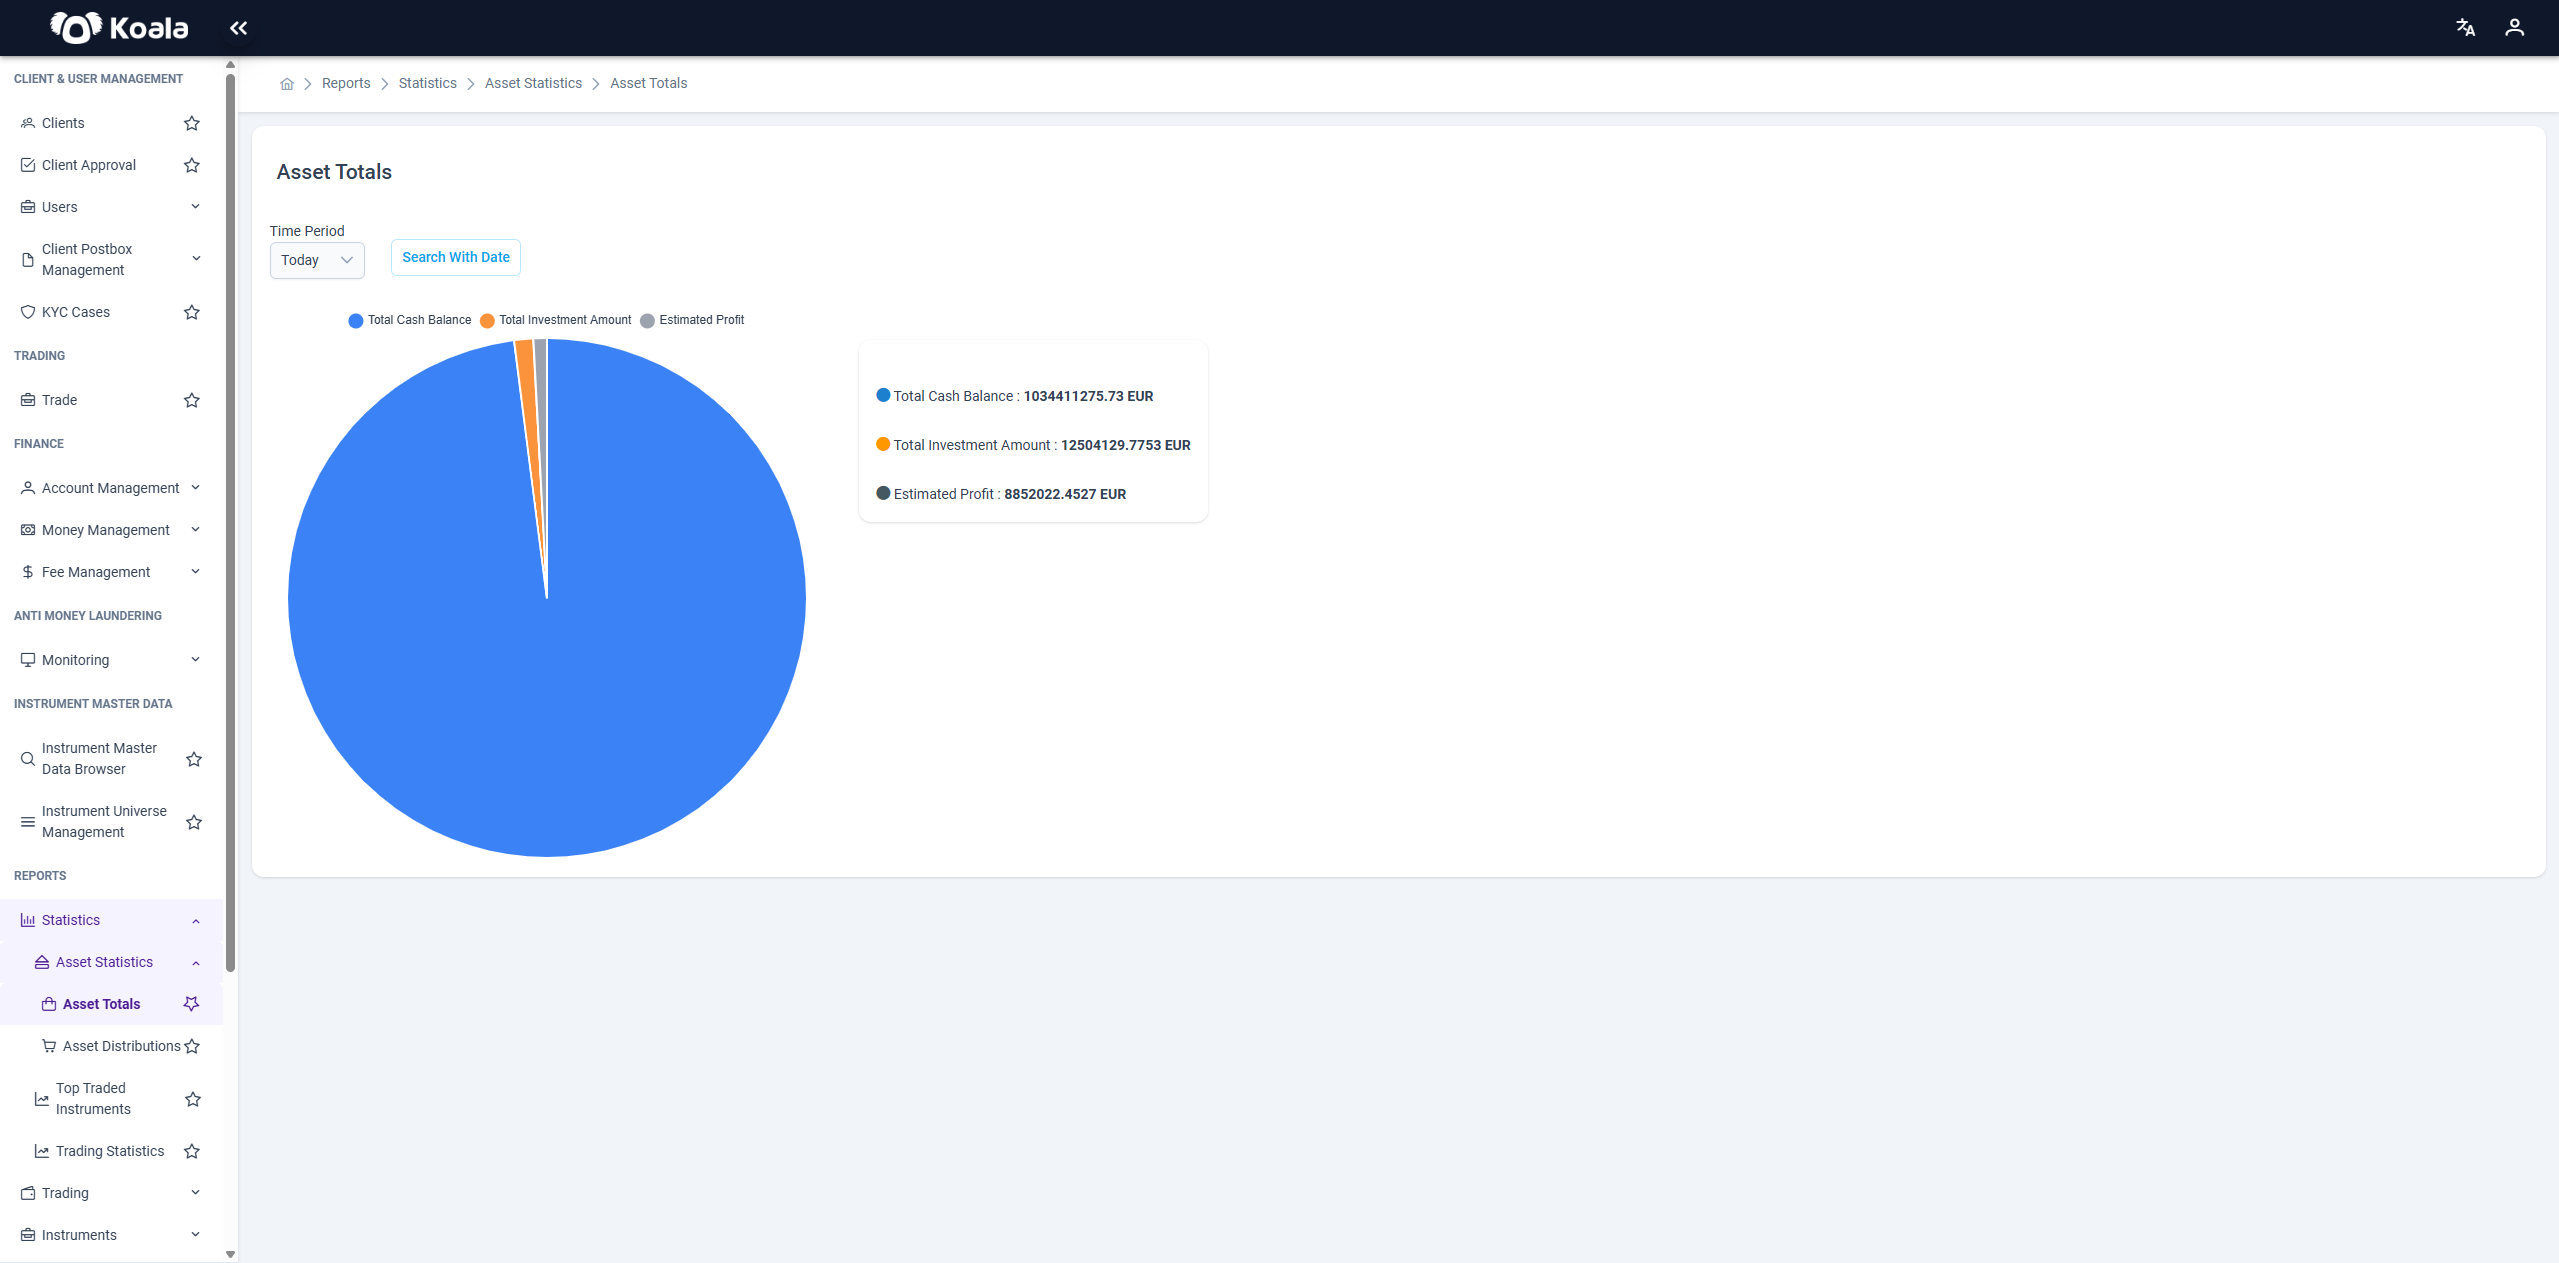
This page also includes:
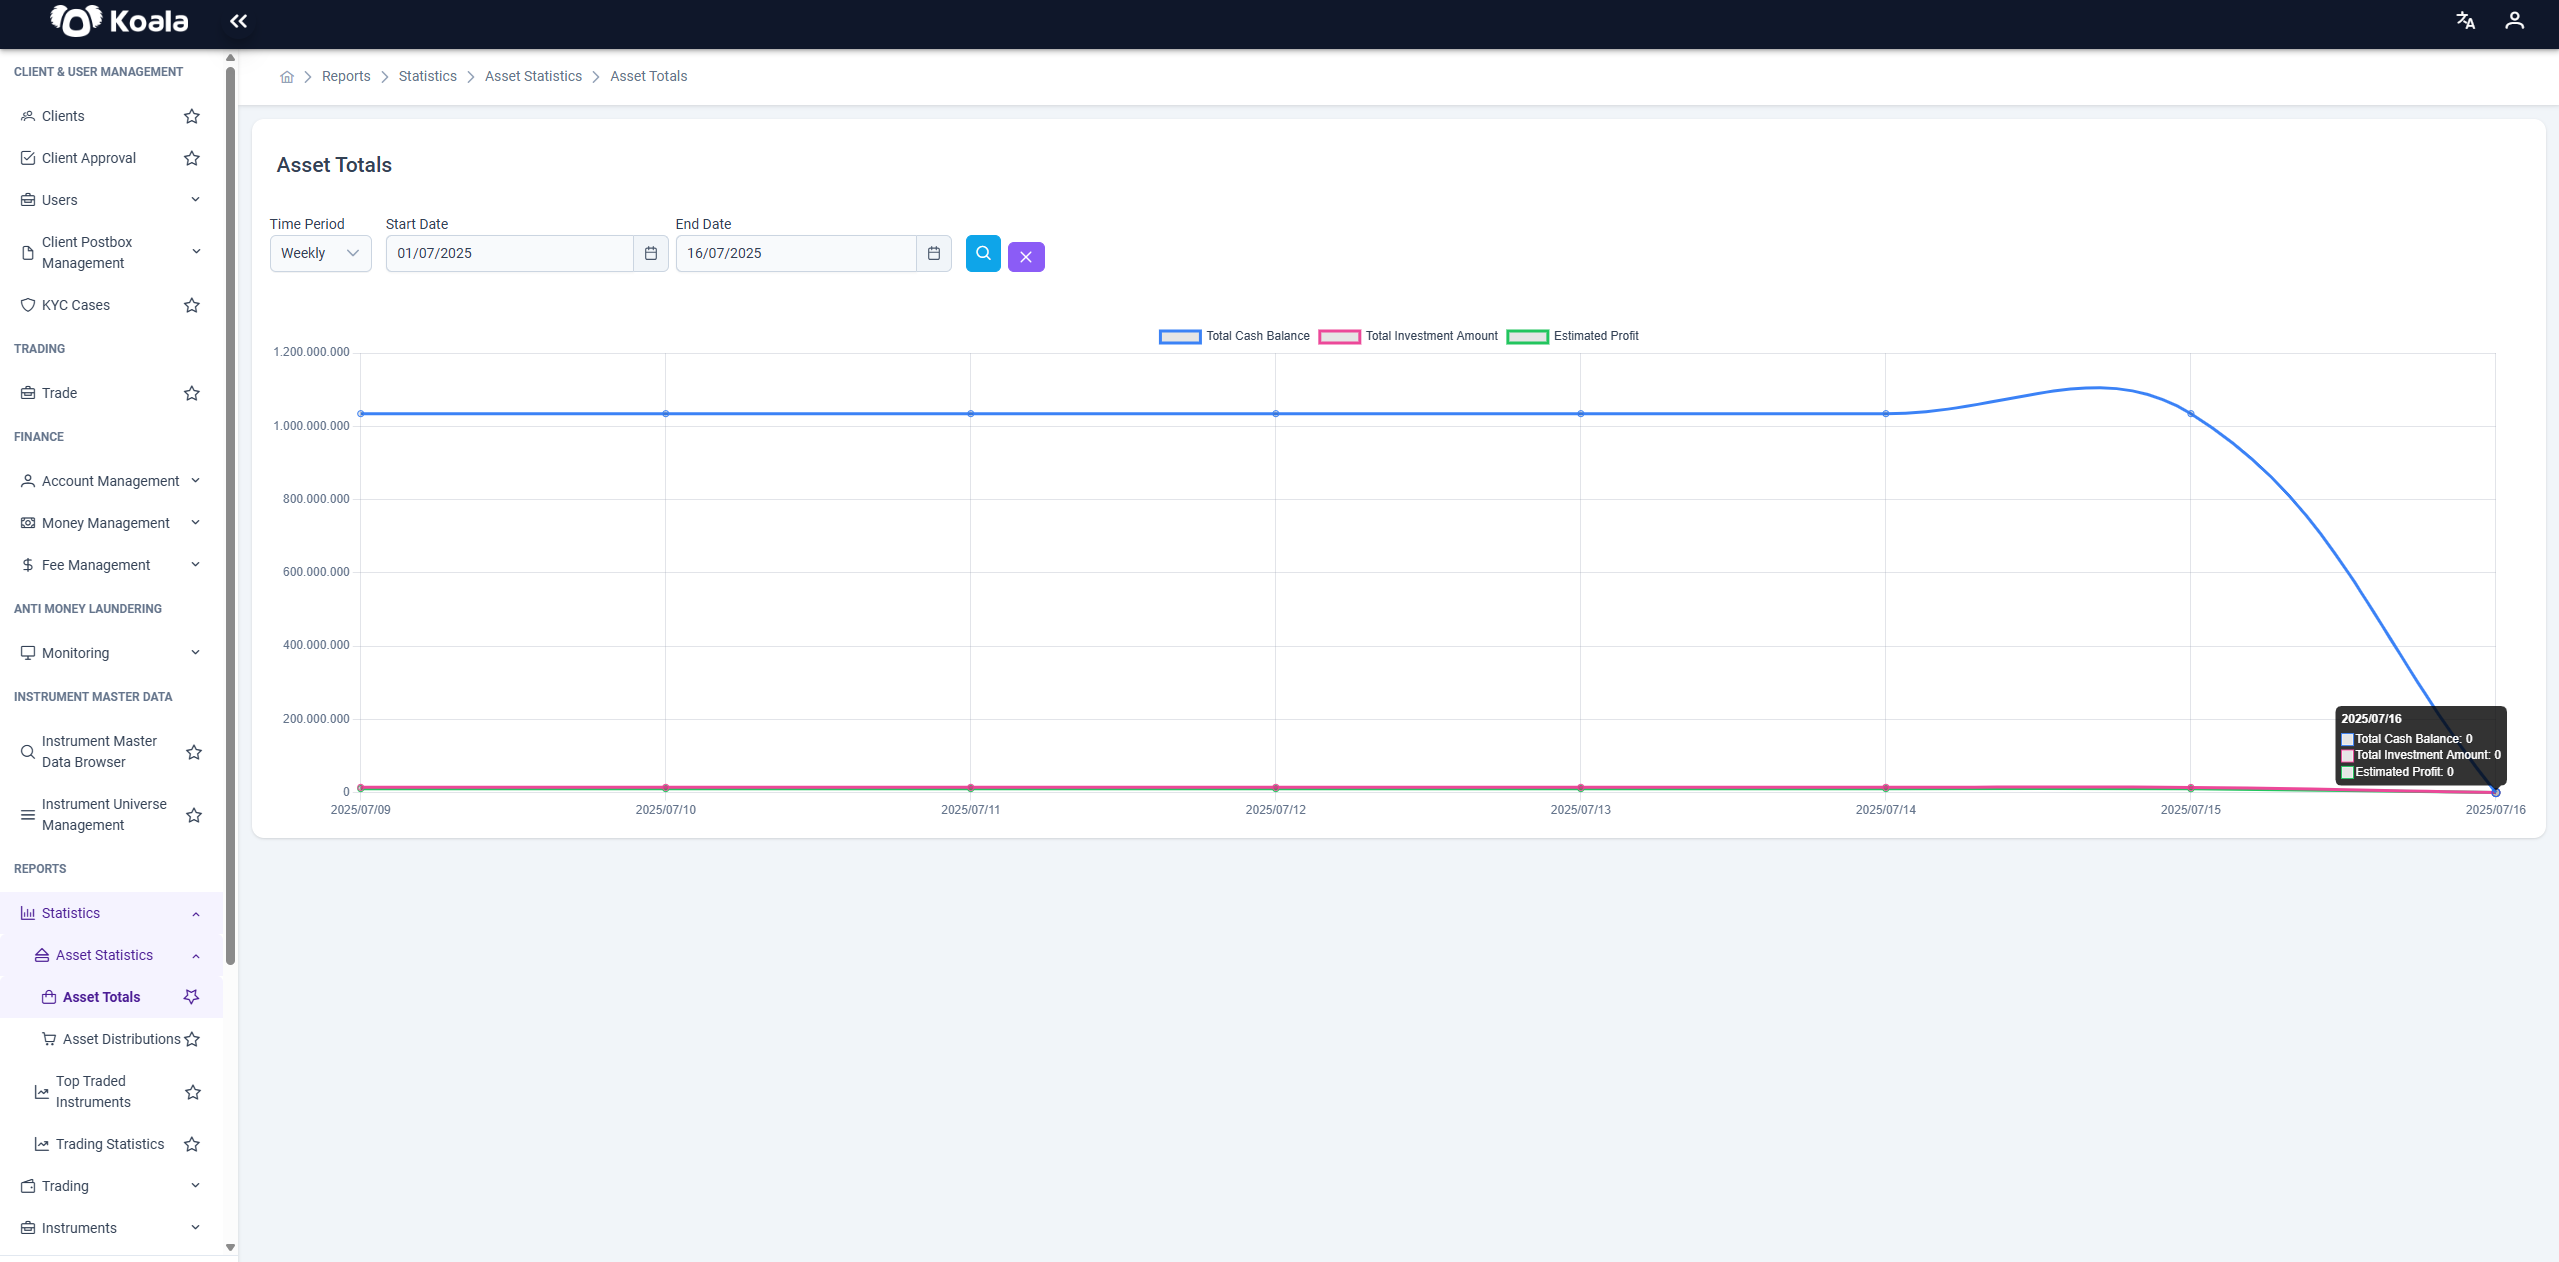
- A Time Period selector: Enables you to view the data aggregated by day, week, month, or year.
- A Search with Date button: Lets you select a specific date range and refresh the chart accordingly.
These tools allow users to drill down into specific periods and compare performance over time.
📊 Asset Distributions
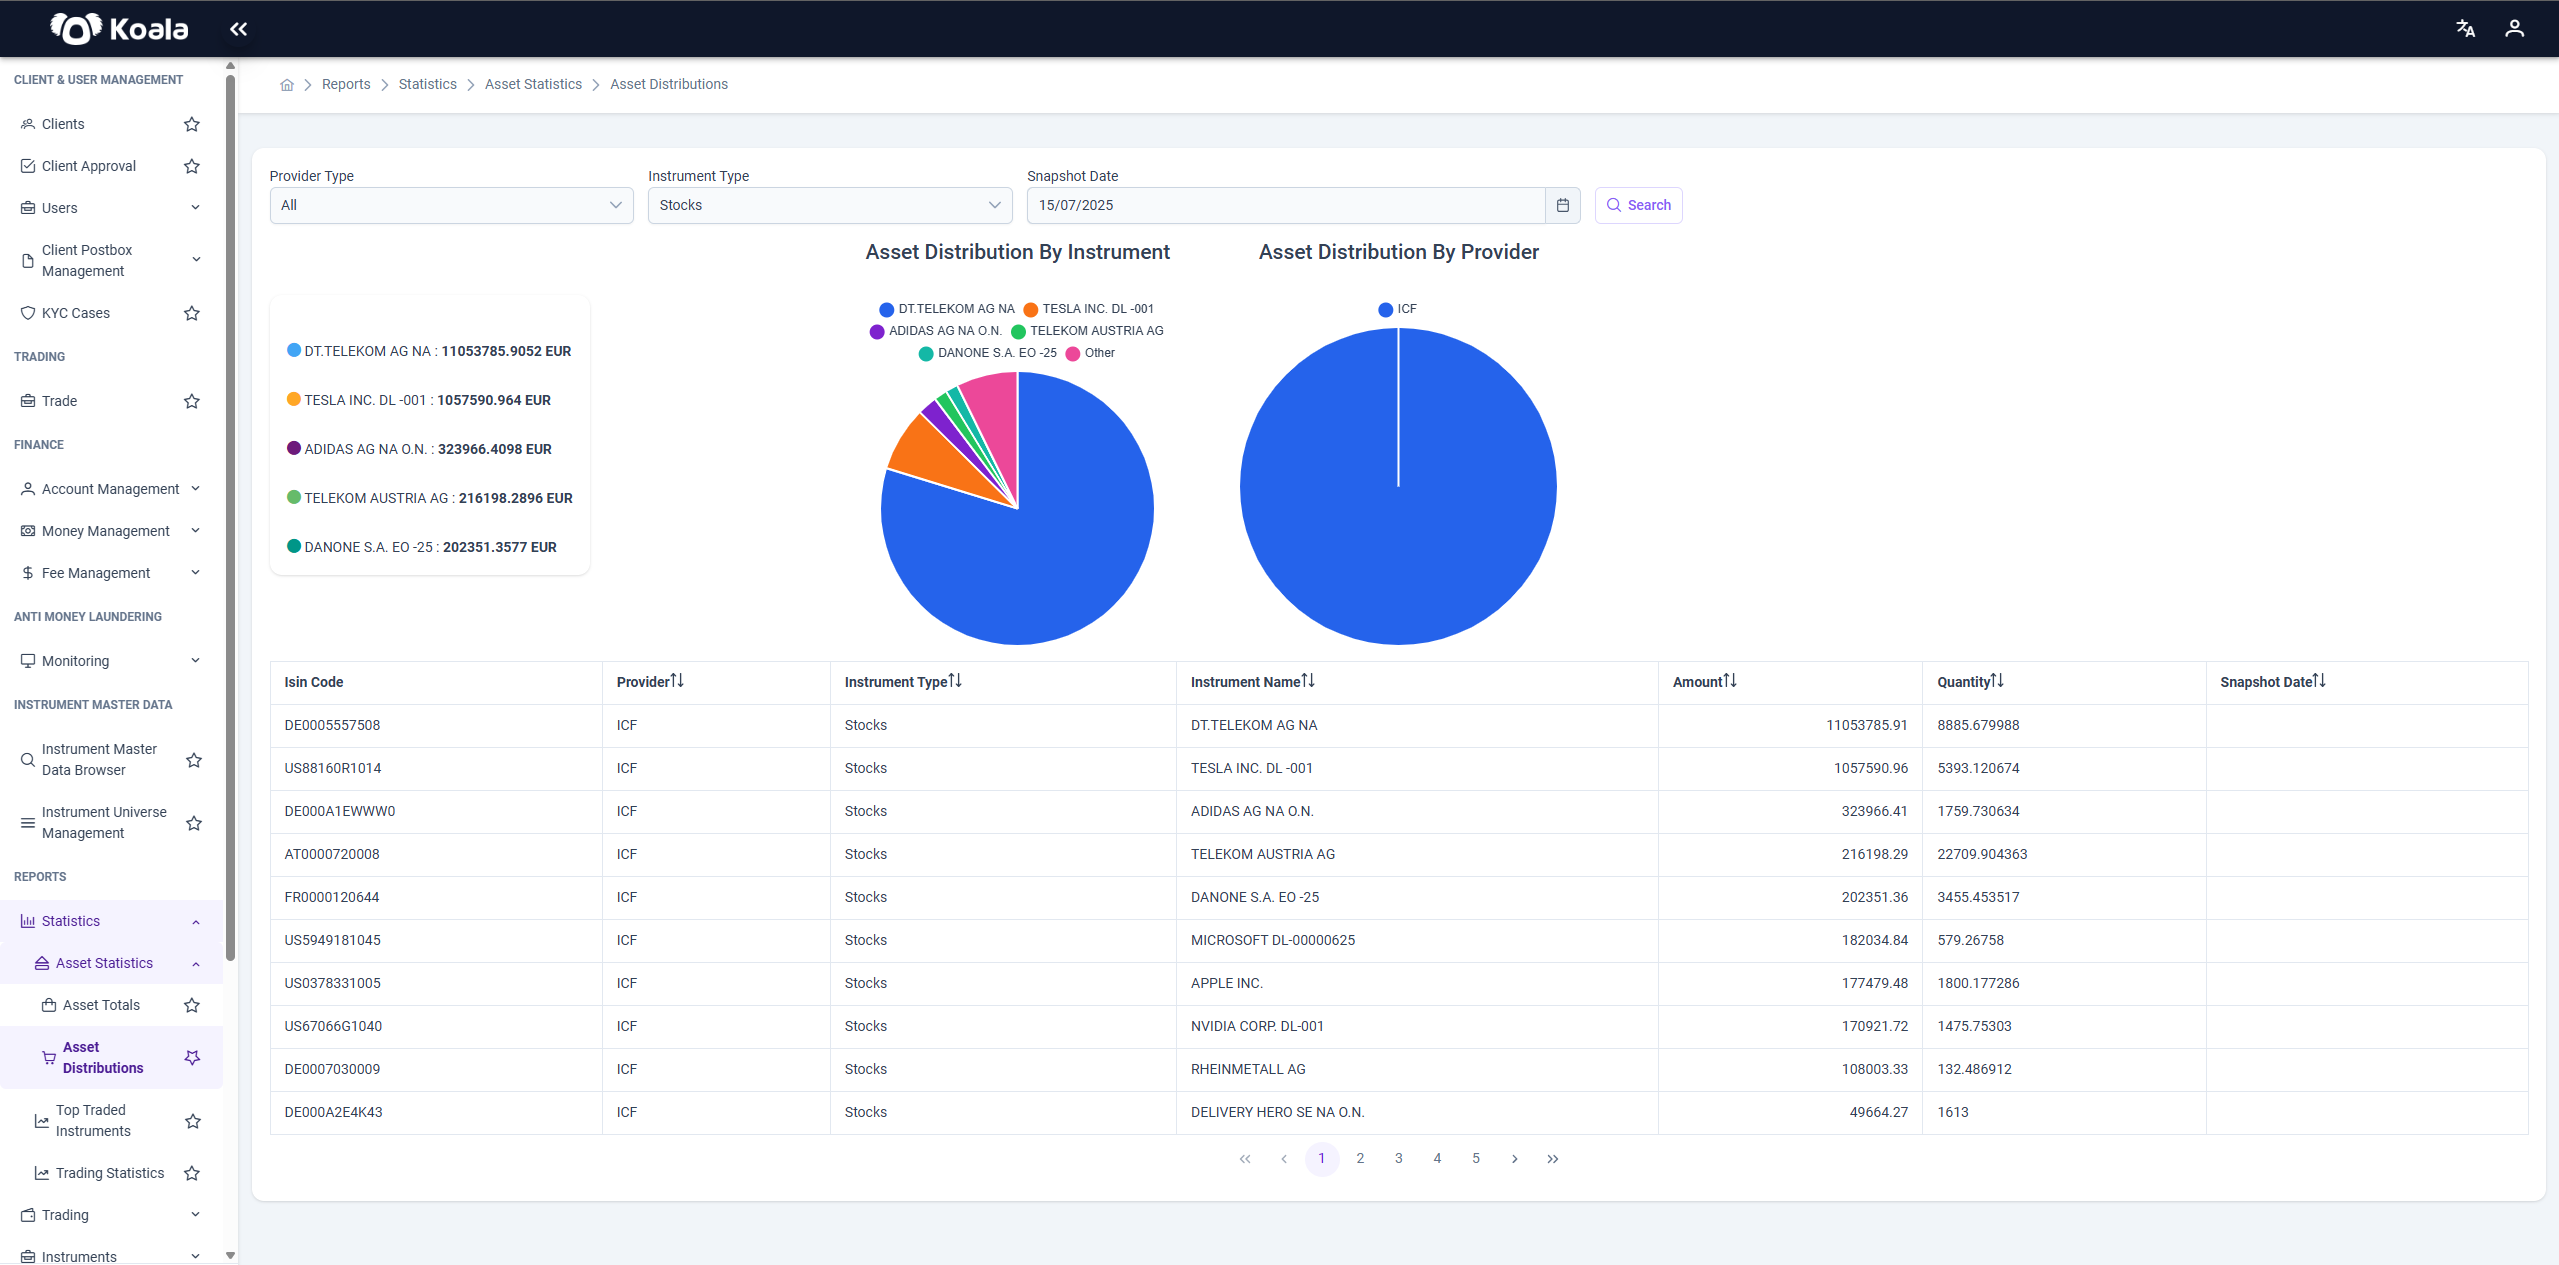
The Asset Distributions page provides a detailed breakdown of how assets are distributed among different instruments and providers.
It consists of:
- Asset Distribution by Instrument: Pie chart showing the proportion of total investment held in each financial instrument.
- Asset Distribution by Provider: Pie chart showing the proportion of assets managed by each provider.
Below the charts, a detailed table lists:
- ISIN Code (unique identifier of the instrument)
- Provider
- Instrument Type
- Instrument Name
- Amount (in EUR)
- Quantity
- Snapshot Date
The page also offers filters at the top:
- Provider Type
- Instrument Type
- Snapshot Date
- Search button
These allow users to refine the distribution view for a specific provider, instrument type, or date.
📈 Top Traded Instruments
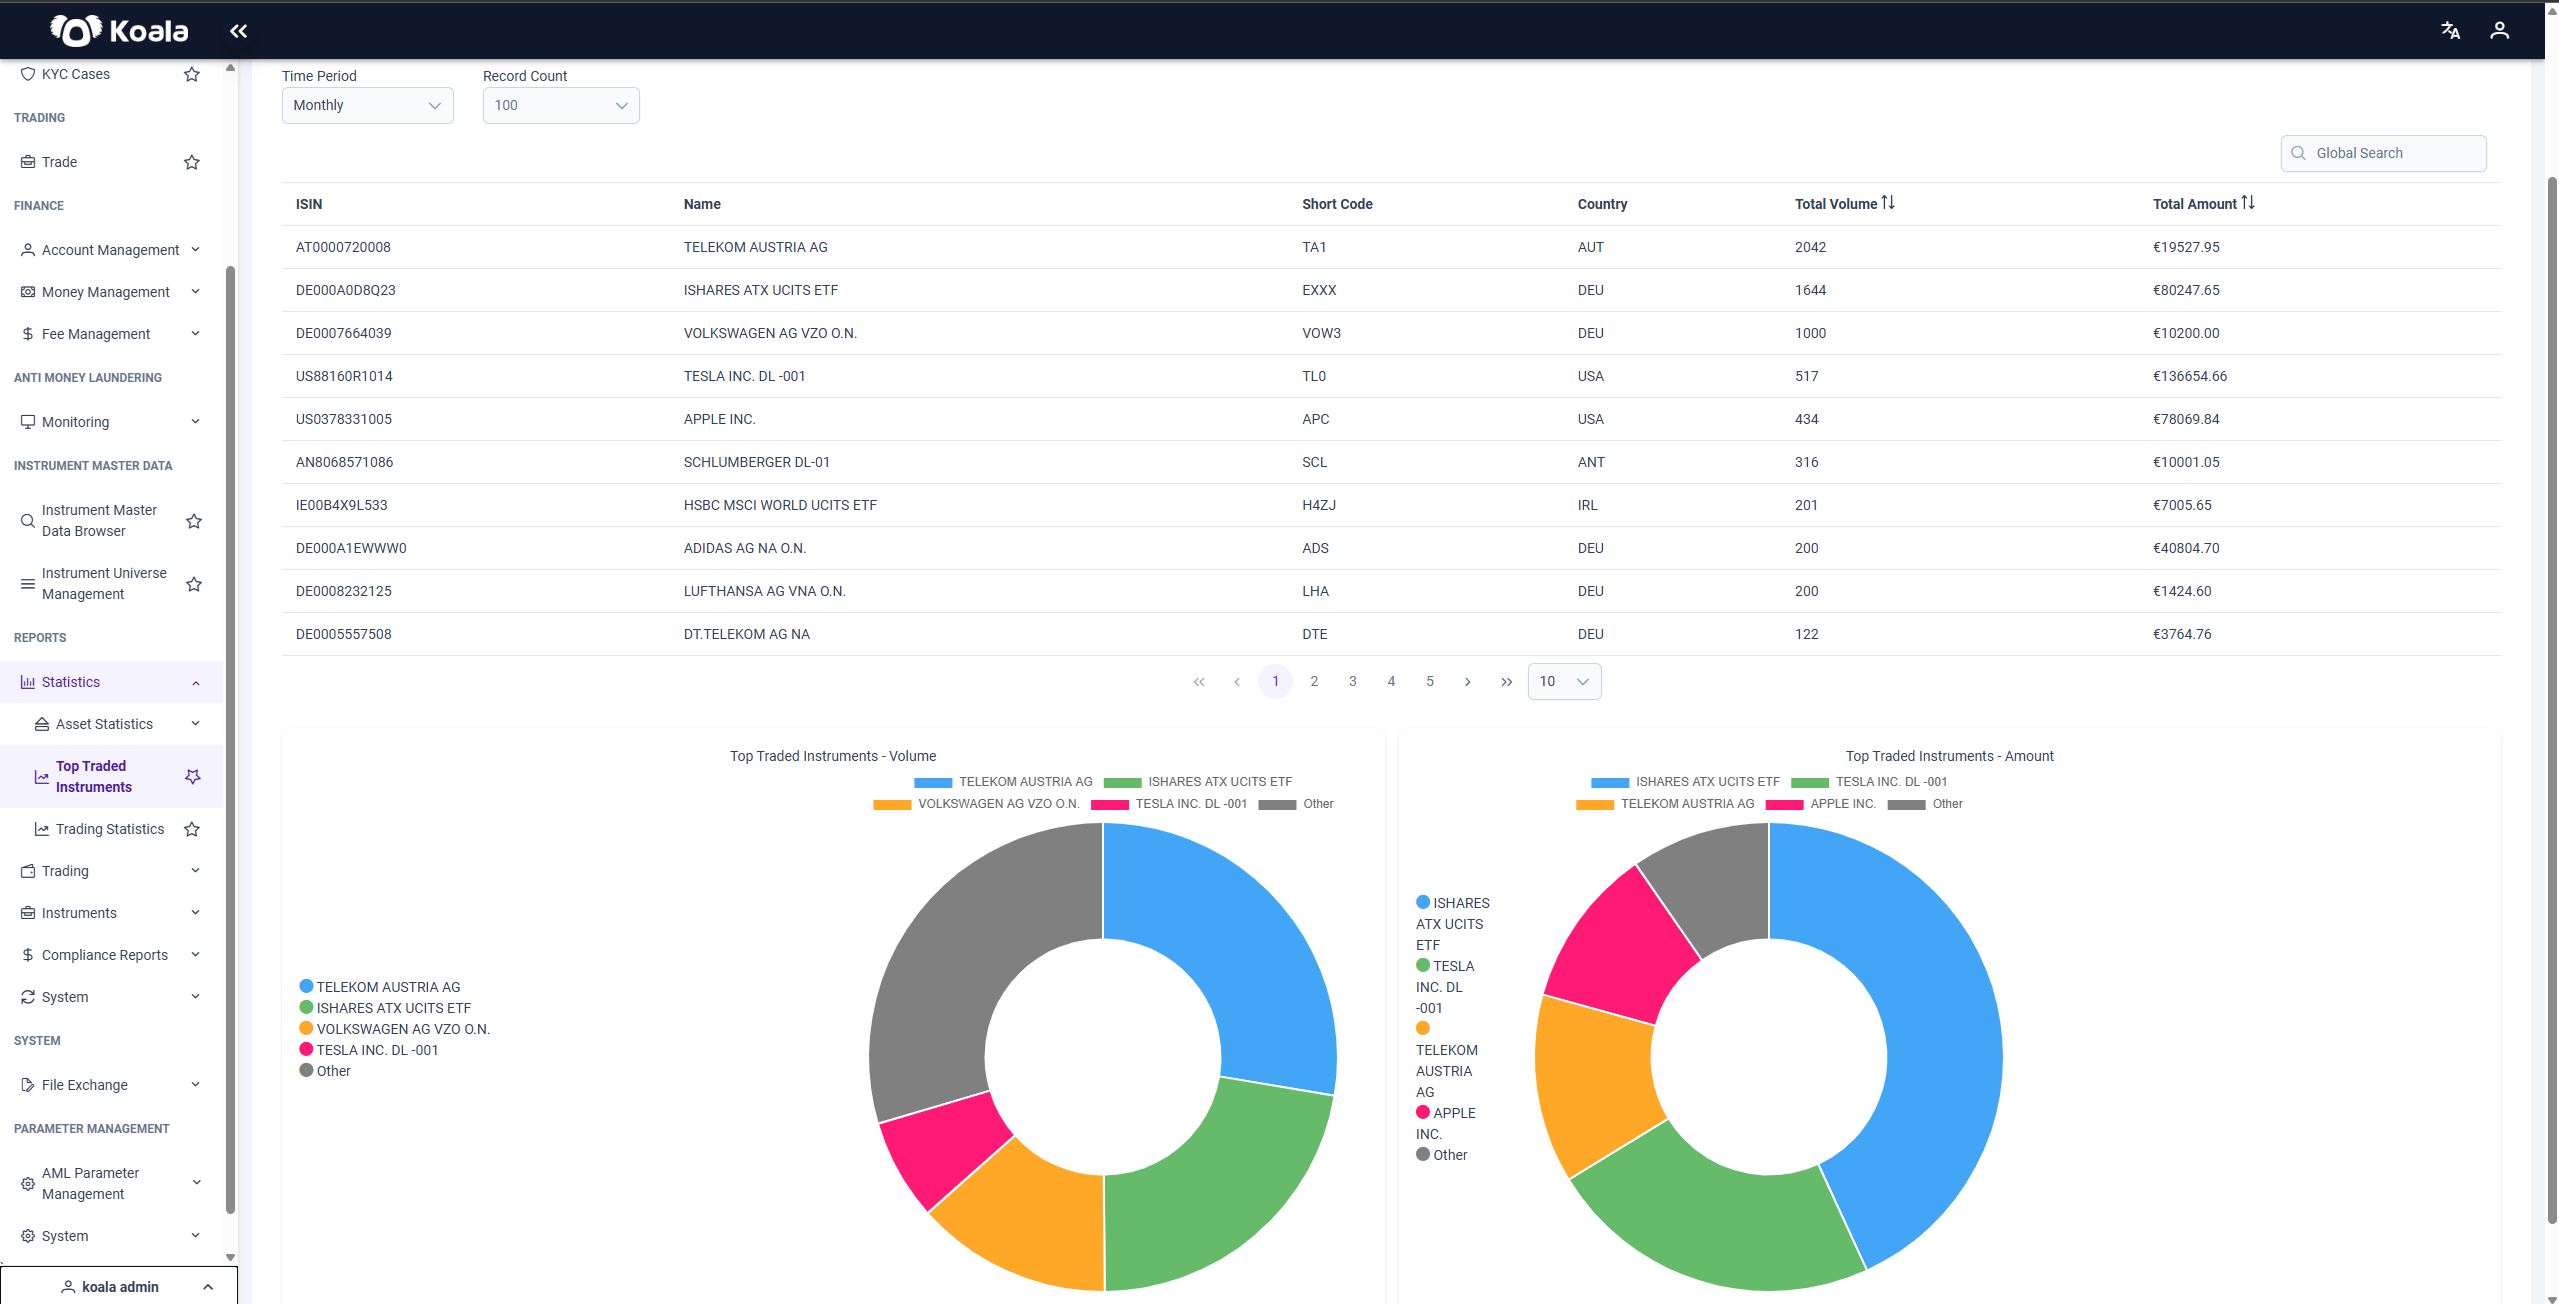
The Top Traded Instruments page highlights the instruments with the highest trading activity within a selected period.
It consists of two tab headers:
- Buy
- Sell
Both tabs show the same type of data; one for buy transactions and the other for sell transactions.
Search Parameters
- Time Period — Select the desired period (daily, weekly, monthly, yearly).
- Record Count — Define how many records to display.
Table Columns
- ISIN — Unique identifier of the instrument.
- Name — Full name of the instrument.
- Short Code — Abbreviated code of the instrument.
- Country — Issuing country of the instrument.
- Total Volume — Total number of traded units.
- Total Amount — Total monetary value of the trades.
Below the table, there are two charts:
- Top Traded Instruments - Volume — Displays the top 5 instruments with the highest trading volume.
- Top Traded Instruments - Amount — Displays the top 5 instruments with the highest total trading amount.
These charts help visualize the most active instruments in the market.
📊 Trading Statistics
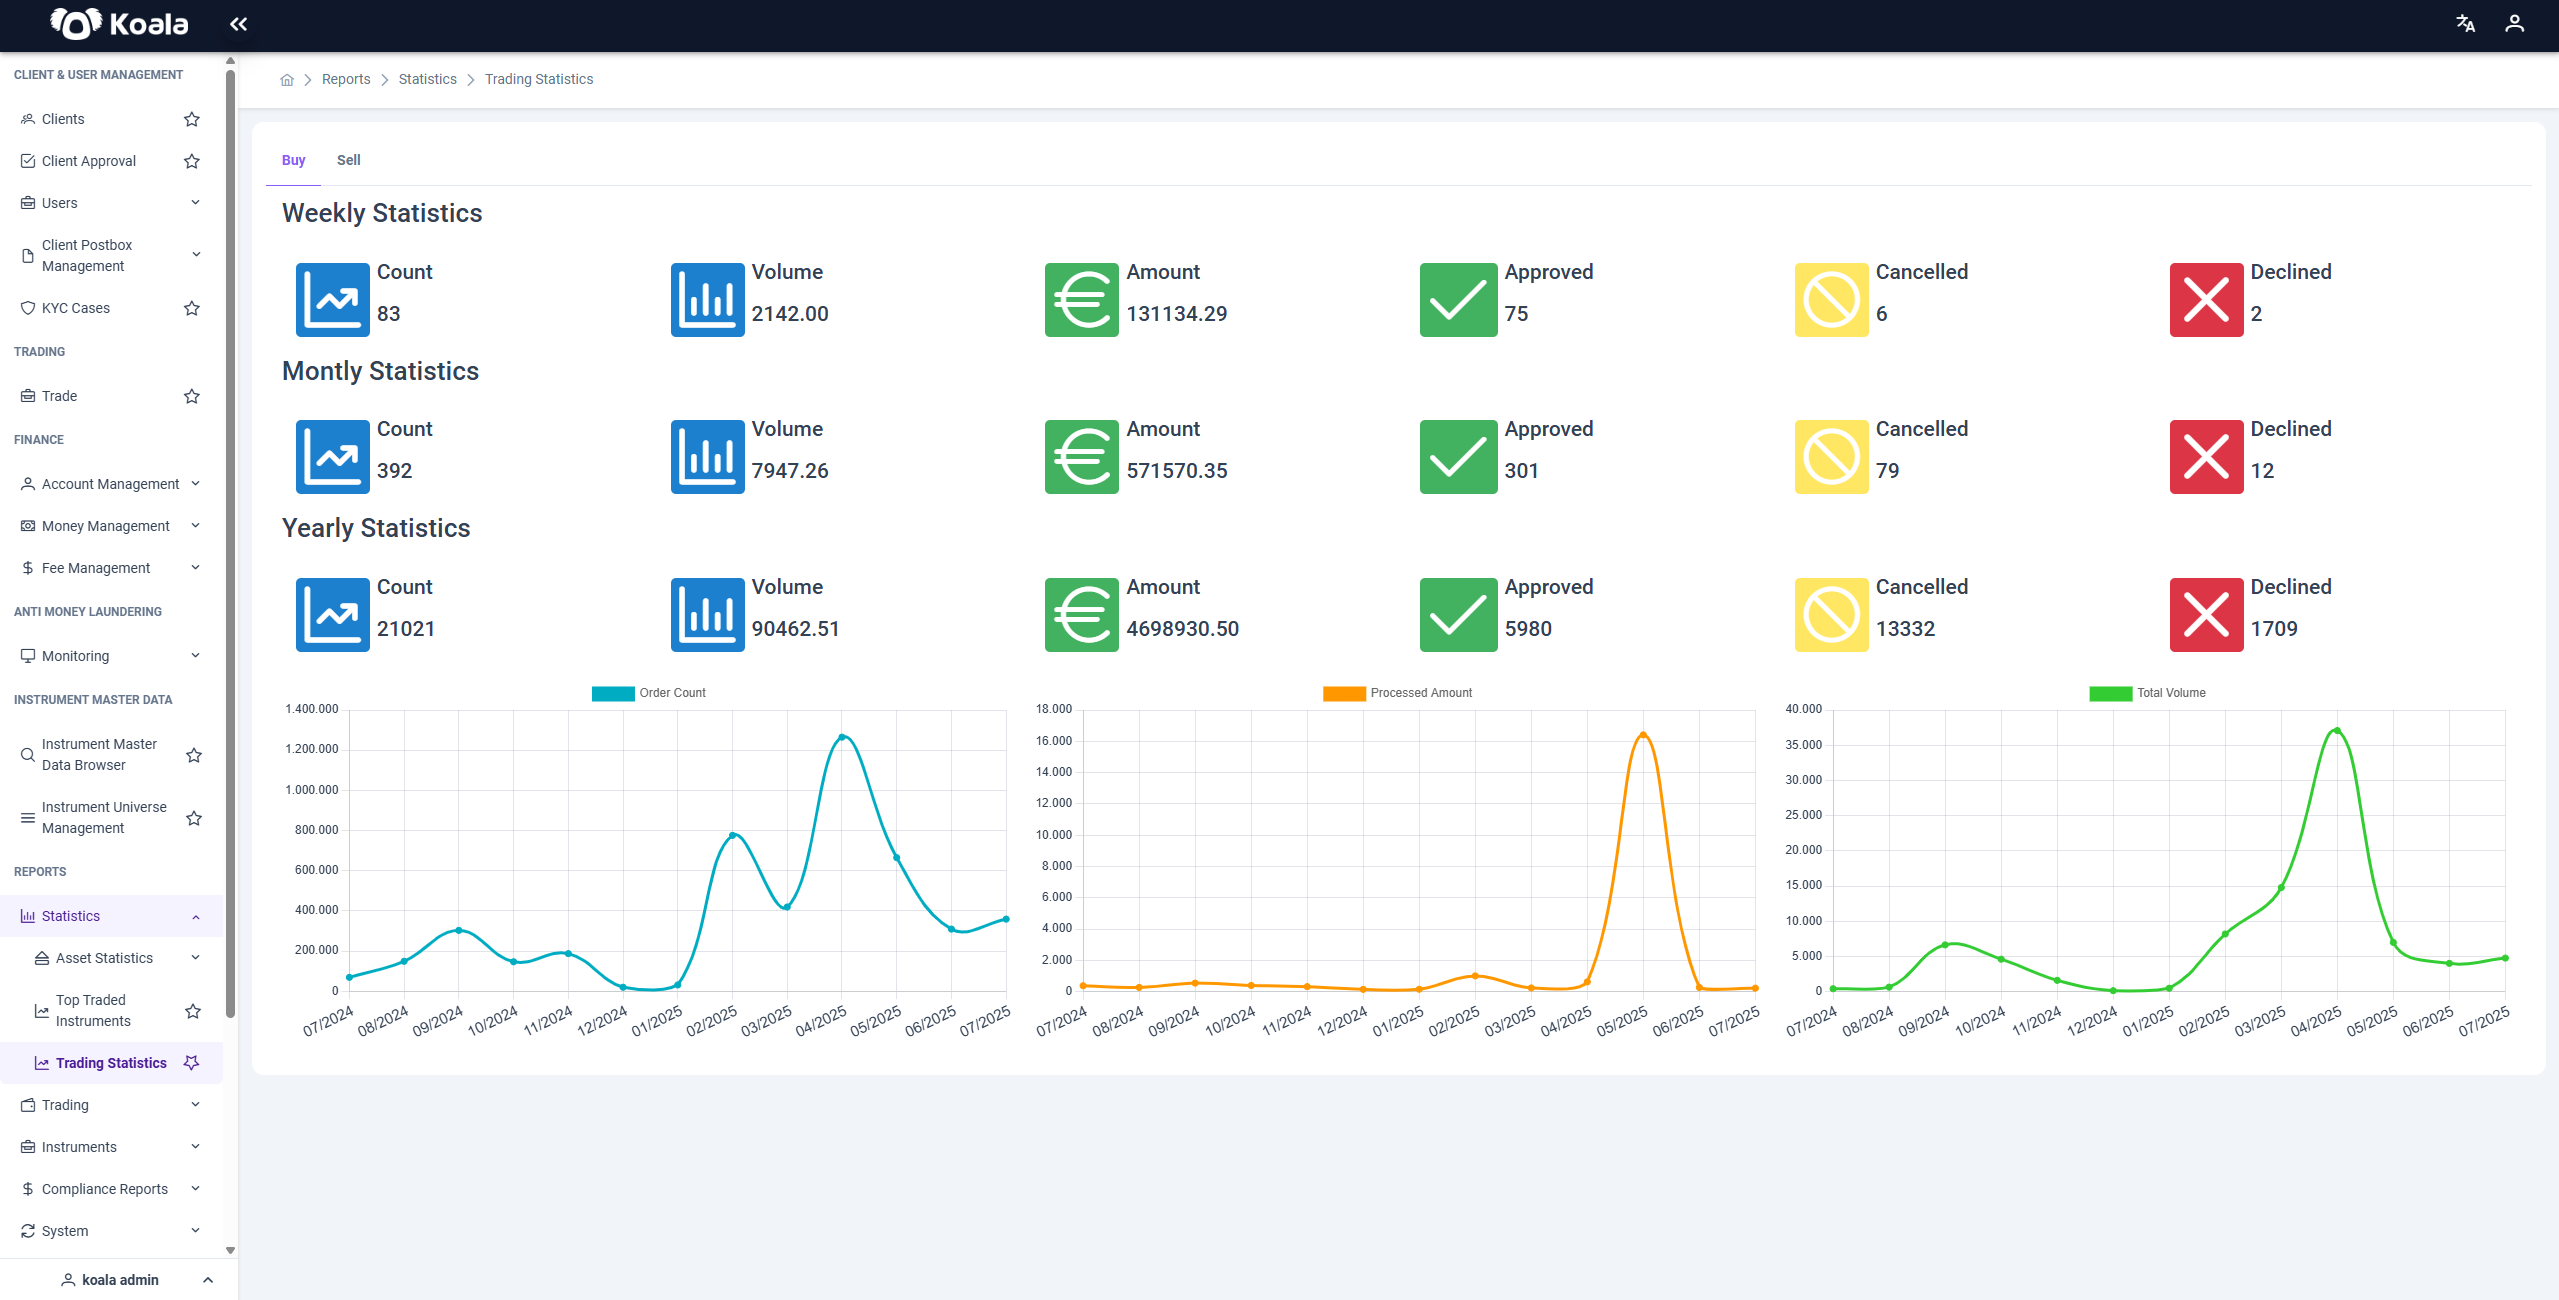
The Trading Statistics page provides an aggregated summary of trading activity categorized by time periods and transaction types.
It also contains two tab headers:
- Buy
- Sell
Both tabs display identical types of data for buy and sell operations respectively.
Time Periods
- Weekly Statistics
- Monthly Statistics
- Yearly Statistics
For each period, the following metrics are shown:
| Metric | Example Value |
|---|---|
| Count | 83 |
| Volume | 2142.00 |
| Amount | 131134.29 |
| Approved | 75 |
| Cancelled | 6 |
| Declined | 2 |
These metrics summarize the number of transactions, their statuses, total amounts, and volumes.
At the bottom of the page, there are three charts showing:
- Order Count
- Processed Amount
- Total Volume
These charts allow users to quickly understand overall trading activity and trends.
✨ Summary
- Asset Totals: Monitor total cash, investments, and estimated profits over time.
- Asset Distributions: Analyze how assets are allocated across instruments and providers.
- Top Traded Instruments: Identify the most actively traded instruments, with charts for volume and amount.
- Trading Statistics: View transaction statistics and outcomes over weekly, monthly, and yearly periods.