📄 System
The System section in the Koala platform provides insights and monitoring tools for system-level activities and integrations.
It includes tools to observe and troubleshoot event flows, file exchanges, messaging, and external system interactions.
- Event Report Queue: Monitor and manage the processing of event reports.
- AllFunds File History: Track historical file exchanges with AllFunds.
- Booking Engine Integration: Monitor the message queues involved in booking engine workflows.
- Downstream Queue Monitoring: Tracks outgoing messages sent to external systems.
- Upstream Queue Monitoring Tracks incoming messages from external systems.
- Fix Messages: Display and track the inbound and outbound FIX protocol messages exchanged with trading venues and counterparties, which are essential for trade execution and confirmation.
- IFR Report: provides a consolidated, period-based financial overview of assets, client money, trading activity, and risk exposures to support internal analysis and regulatory reporting.
🔗 Event Report Queue
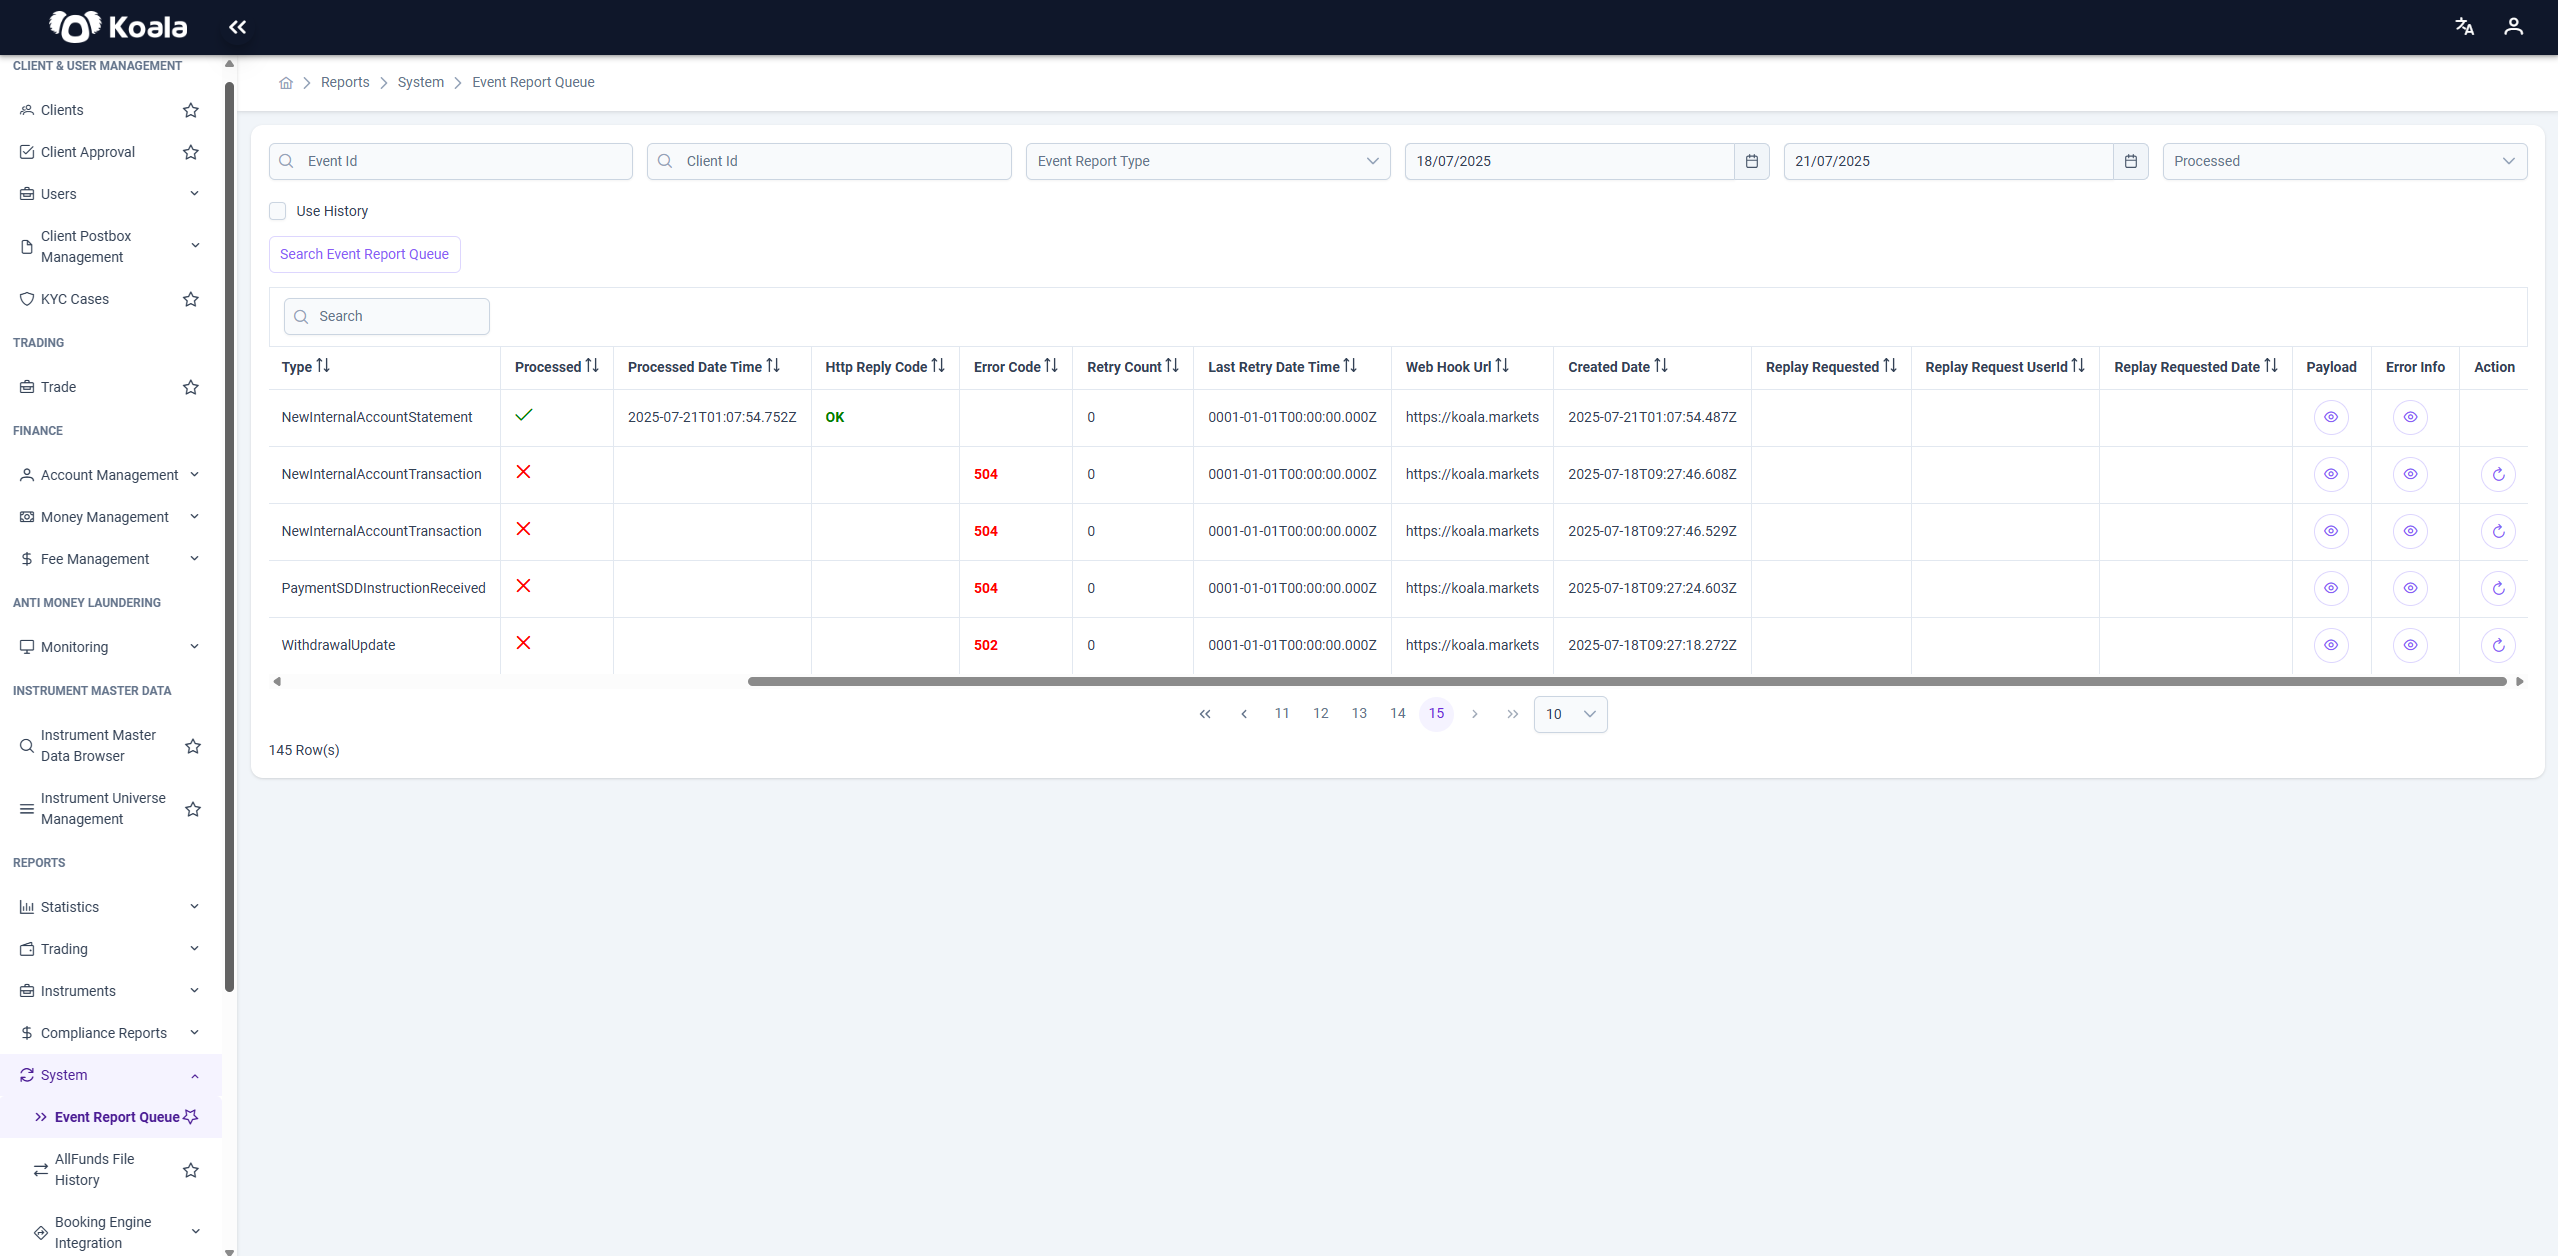
An Event Report is a system-generated notification representing an event that occurred in the platform (e.g., a new account statement, a transaction, a withdrawal, or a direct debit instruction).
These events are typically pushed to external systems or clients through webhooks or APIs.
The Event Report Queue displays and manages the lifecycle of these event reports:
- Shows which reports have been successfully processed.
- Highlights failed reports that require investigation or replay.
- Provides details like processing timestamps, HTTP reply codes, error information, and retry attempts.
🔍 Filters & Search
At the top, users can filter event reports by:
- Event ID
- Client ID
- Event Report Type (e.g., NewInternalAccountStatement, PaymentSDDInstructionReceived, etc.)
- Date range
- Processed status
Additionally, there is a Use History checkbox:
When checked, the search includes event report records that have been processed at least once with success and are older than 120 days, which are moved to a history table.
📄 Table Columns
Below the filters, the table lists event reports with the following key columns:
| Column | Description |
|---|---|
| Event Id | Unique identifier for the event report |
| Client Id | The client associated with the event |
| Type | Type of event (e.g., transaction, withdrawal, account statement) |
| Processed | Indicates if the event was successfully processed |
| Processed Date Time | Timestamp when the event was processed |
| HTTP Reply Code | Response code from the webhook/API (e.g., OK, 504) |
| Error Code | Internal error code if applicable |
| Retry Count | Number of retry attempts |
| Last Retry Date Time | When the last retry attempt was made |
| Webhook URL | Destination endpoint where the event is sent |
| Replay Requested | Indicates if a replay request has been made |
| Replay Request User Id | User who requested the replay |
| Replay Request Date | When the replay request was submitted |
| Payload | View the full JSON payload of the event |
| Error Info | View detailed error information in JSON format |
| Action | Button to trigger an Event Report Replay |
🔧 Actions
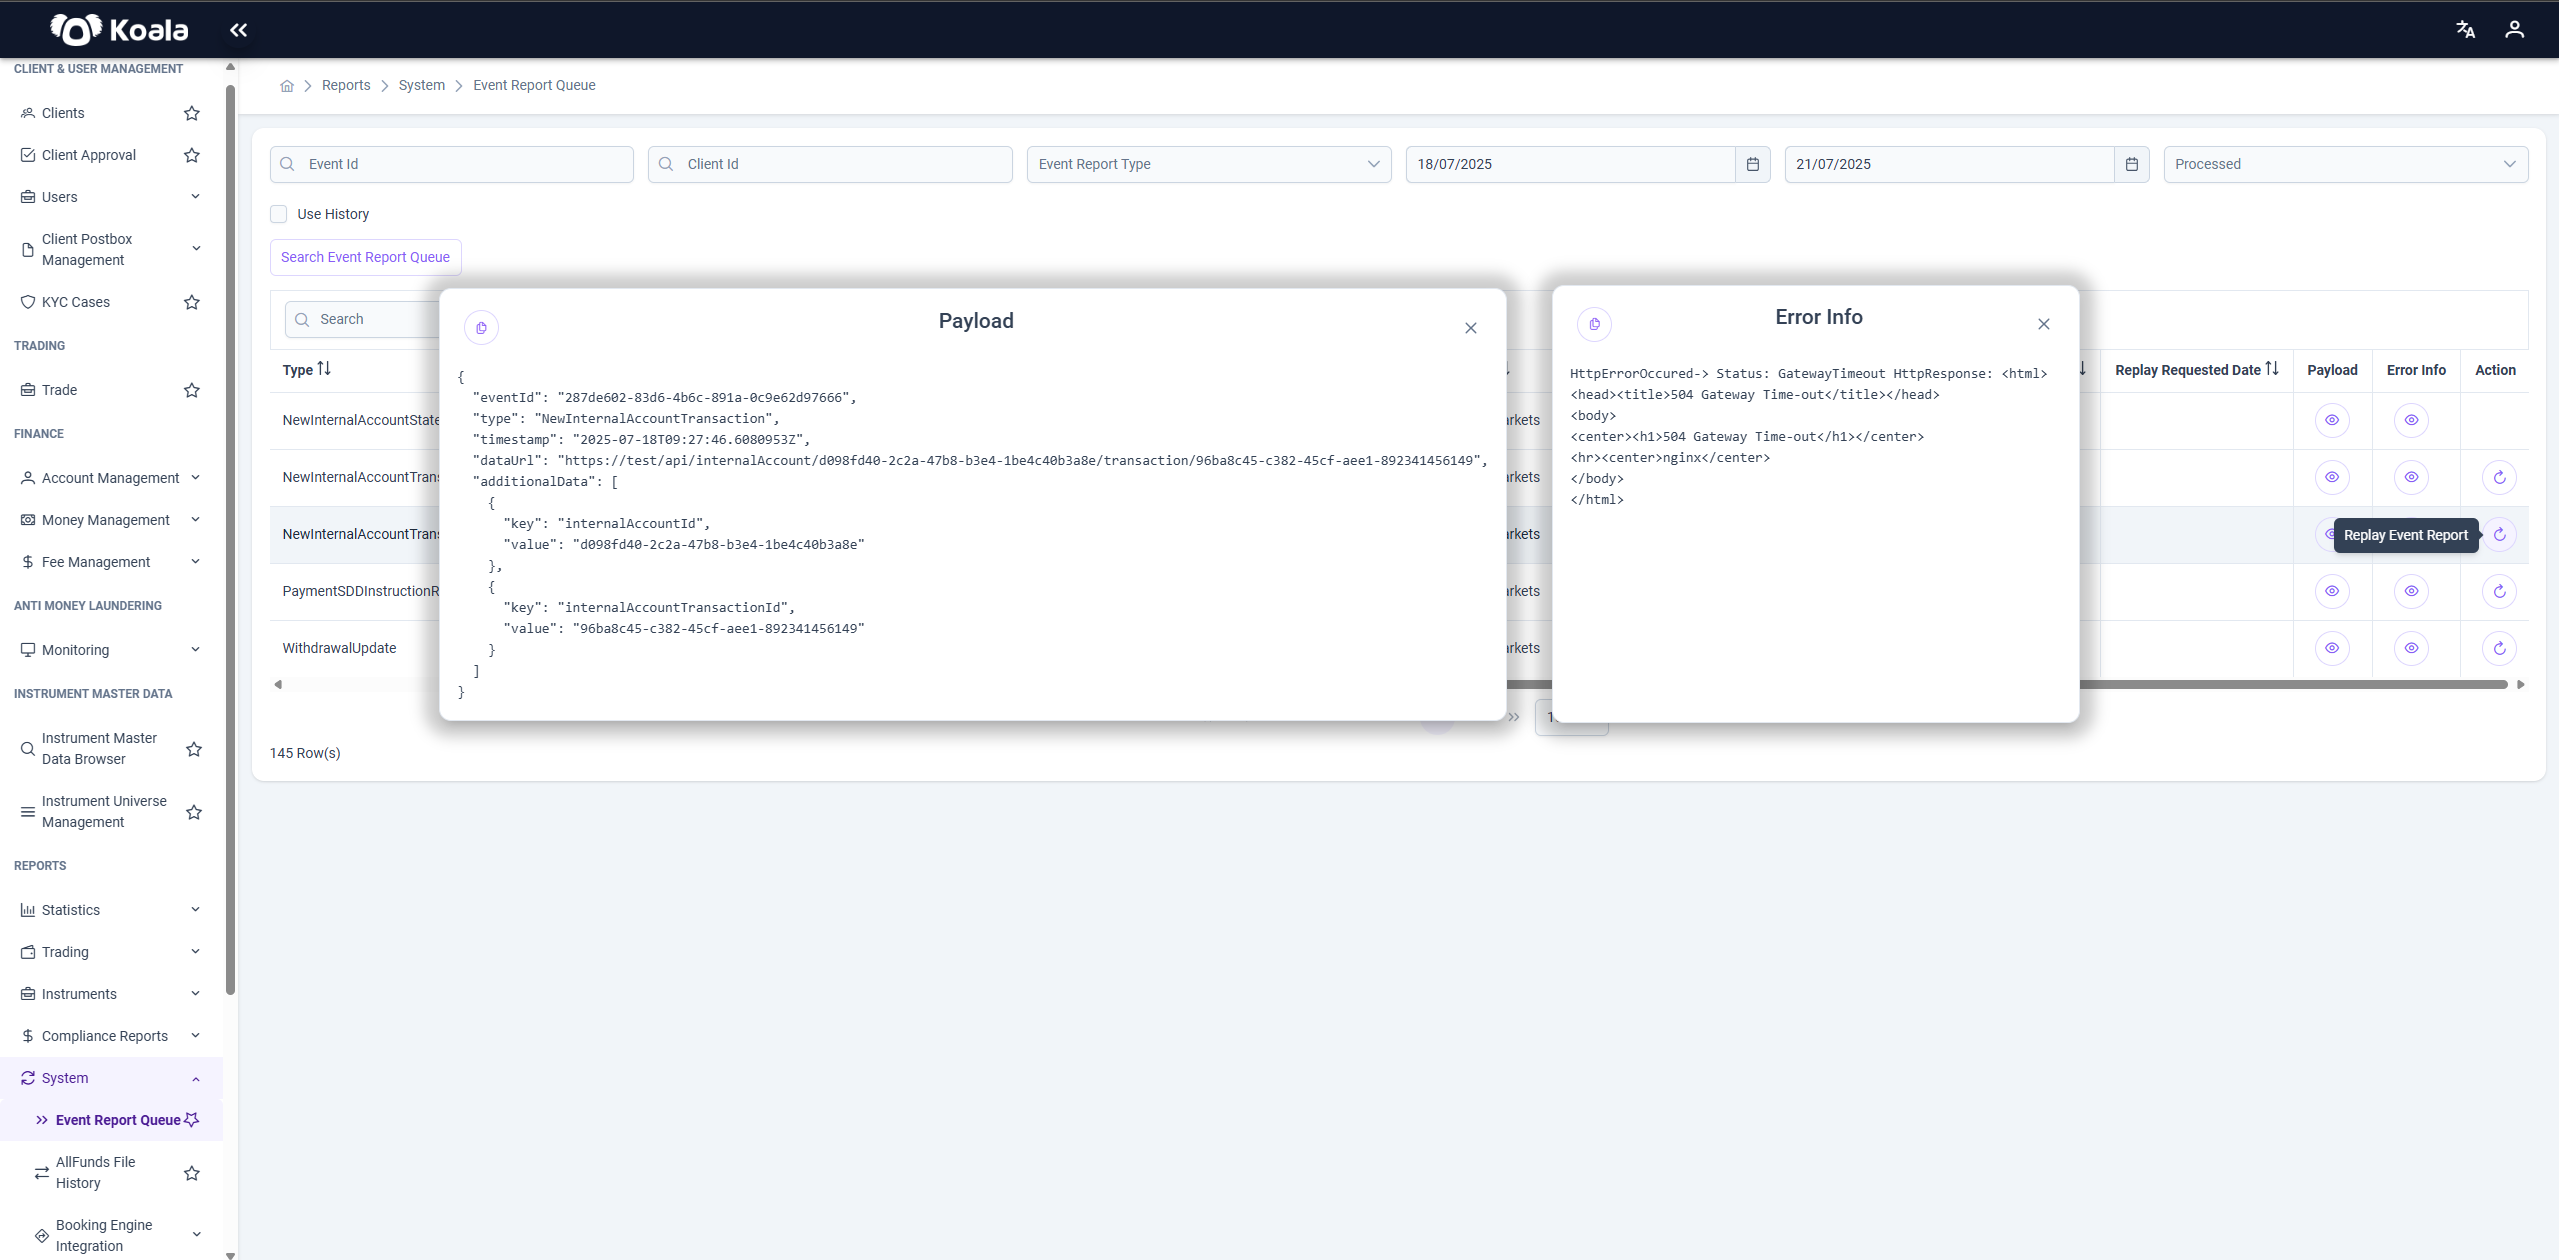
For each event report, an Action button is available that enables:
-
Event Report Replay: If the report previously failed, this action triggers a reprocessing of the event and resends it to the webhook/API.
-
View Payload & Error Details: Opens dialogs displaying the full event payload and any associated error information in JSON format, allowing for detailed troubleshooting.
-
🧾 Summary
The Event Report Queue page is a crucial operational tool for monitoring and managing system events.
It ensures that all important events are successfully delivered to external systems or clients and provides mechanisms for retrying and investigating failures efficiently.
The Use History feature ensures that even archived, older events (older than 120 days) can be queried and reviewed if needed.
Additional columns for Replay Requested, Replay Request User Id, and Replay Request Date allow tracking of replay requests and accountability for actions taken.
This functionality helps maintain data integrity, ensures timely delivery of critical events, and supports operational resilience in the face of transient errors.
The broader System section also includes monitoring of FIX messages, booking engine queues, and historical file transfers — enabling a complete view and control over system integrations and communications.
📄 AllFunds File History
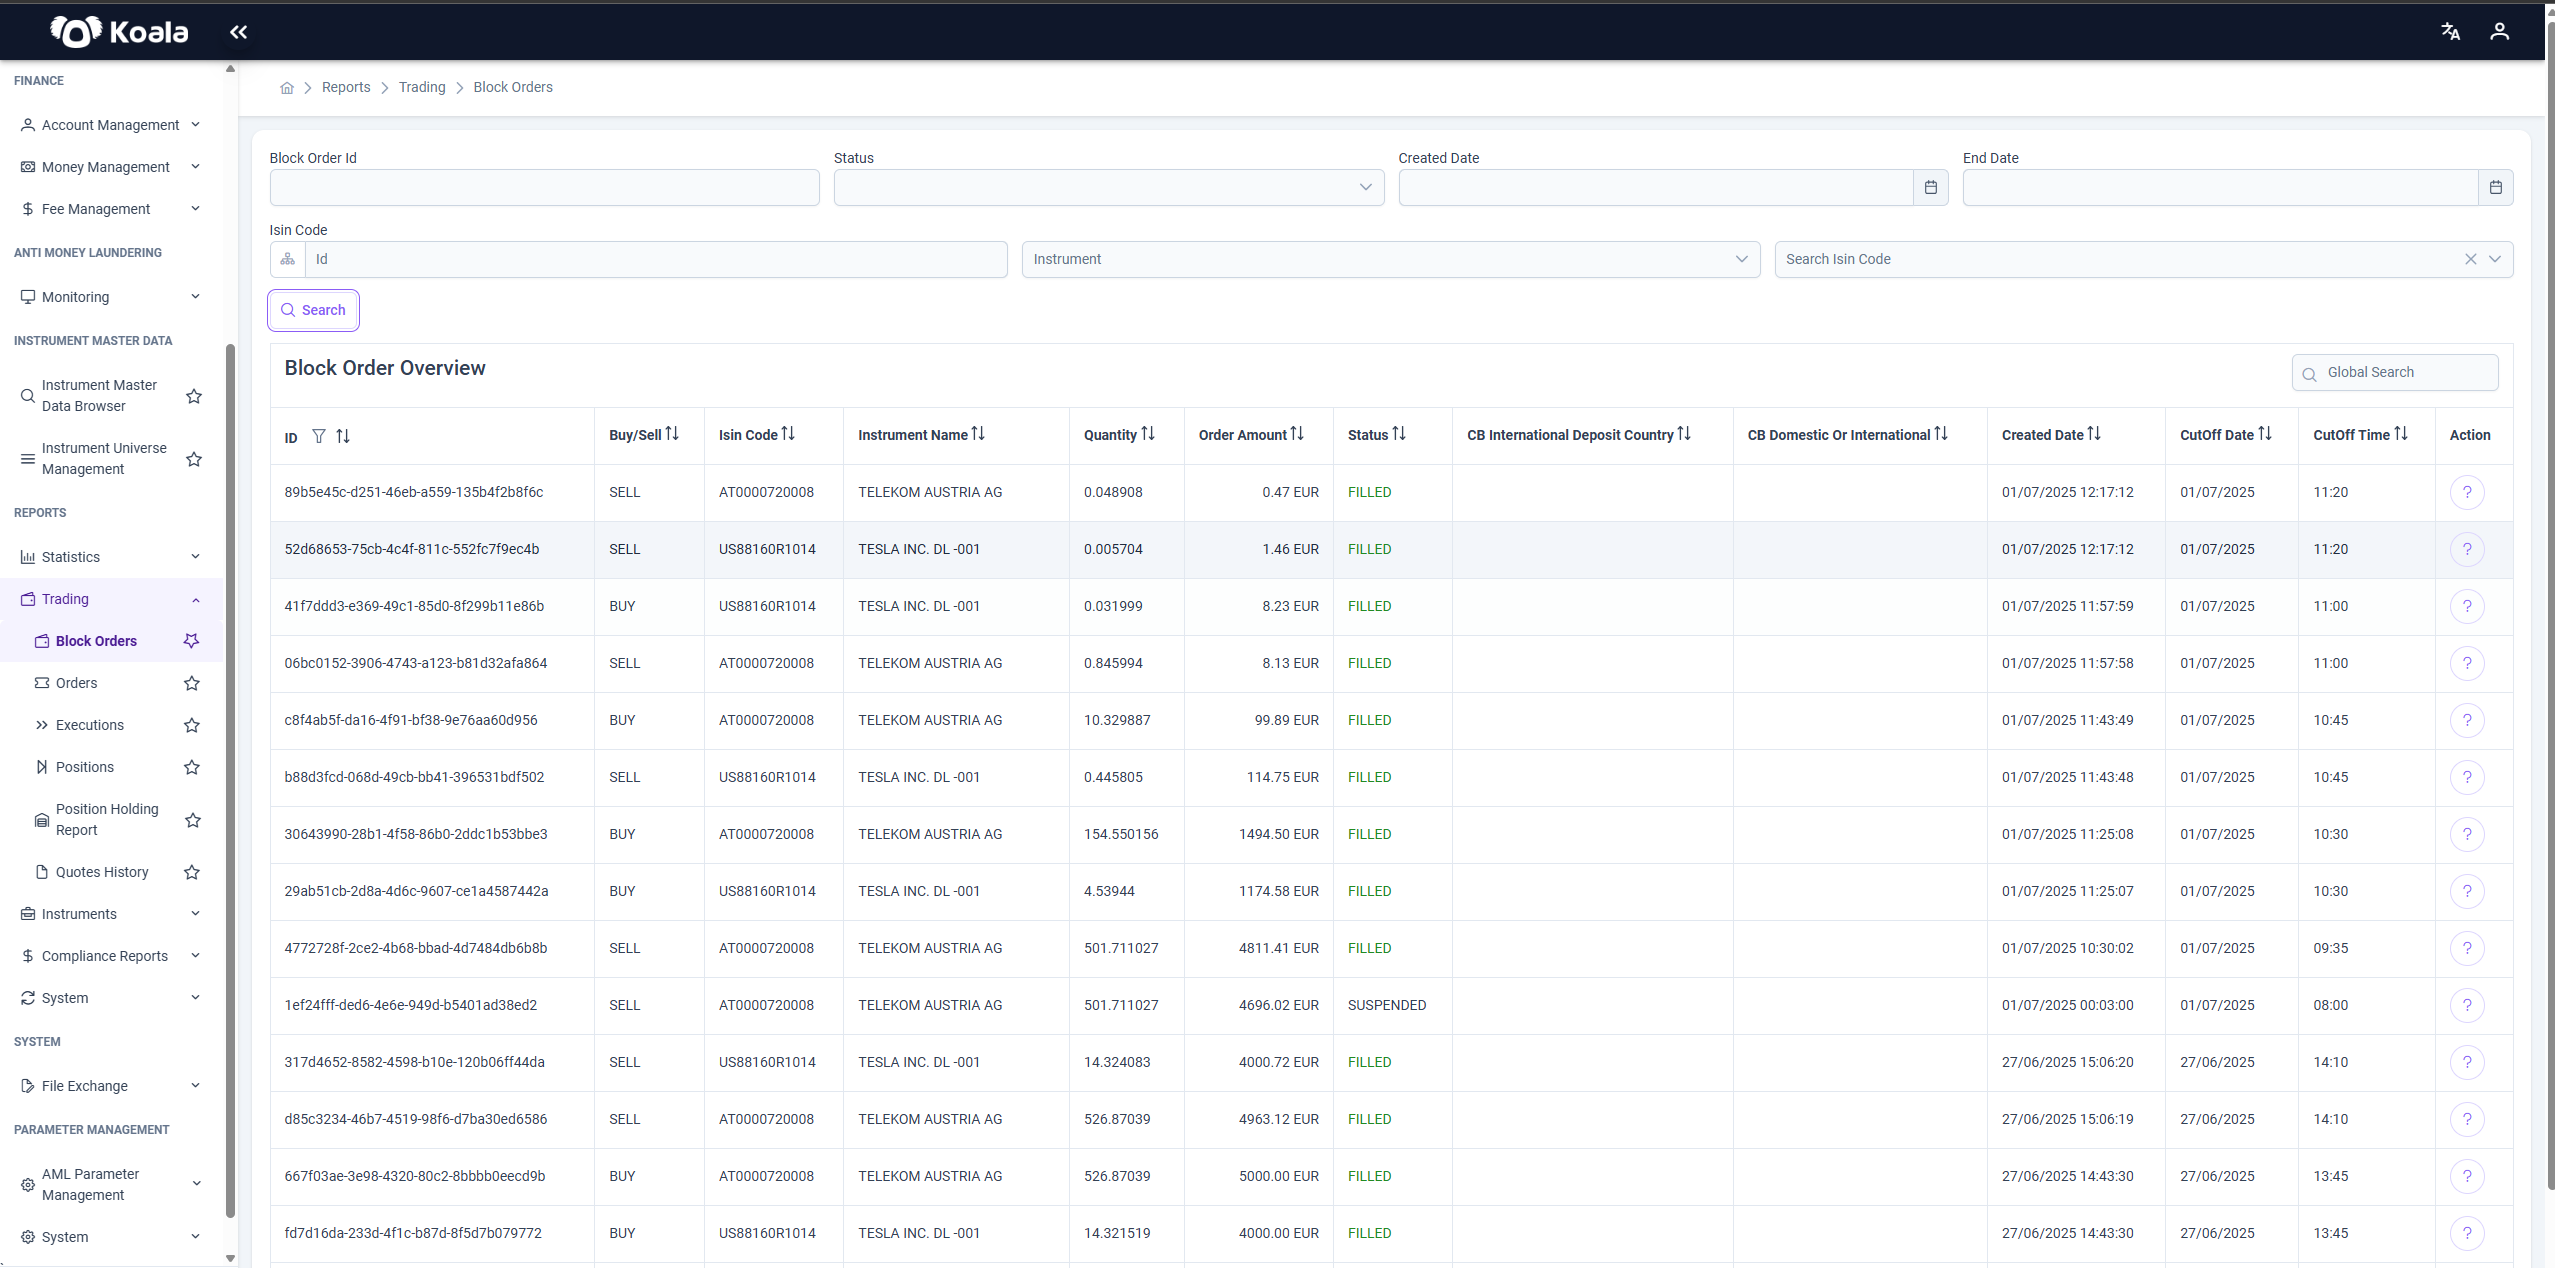
The AllFunds File History page provides a comprehensive view of the file transfers exchanged between the Koala platform and the AllFunds system.
AllFunds is a third-party platform for fund distribution and investment services.
This page allows operations and compliance teams to:
- Monitor the upload and download of files (e.g., orders, confirmations, reports) between Koala and AllFunds.
- Track the processing status of each file.
- Identify and resolve errors in the file transfer process.
🧭 Page Overview
At the top of the page, a filter & search area lets users narrow down the file records based on:
- Start Date / End Date (Required): Time range for the file transfers.
- File Type
- Transfer Status (e.g., Uploaded, Processed, Error)
- Transfer Direction (Upstream or Downstream)
After clicking Search, the results table below displays all matching file transfer records.
📋 Table Columns
| Column | Description |
|---|---|
| File Type | Type of file (e.g., OU, IN, E2) |
| File Name | The name of the transferred file |
| Transfer Status | Status of the file (e.g., DownstreamProcessed, UpstreamUploaded, Error) |
| Transfer Direction | Direction of the transfer: |
| Upstream: Files sent from Koala to AllFunds | |
| Downstream: Files received by Koala from AllFunds | |
| FTP Path | FTP path where the file was uploaded/downloaded |
| Cutoff Date | Date of cutoff (if applicable) |
| Cutoff Time | Time of cutoff (if applicable) |
| Created Date | When the file record was created |
| Update Date | Last time the file record was updated |
| Error Description | Details of any error that occurred during transfer (if any) |
🔧 Usage & Purpose
This page is essential for:
- Auditing the file flow between Koala and AllFunds.
- Ensuring all files have been successfully processed.
- Investigating and resolving failed file transfers using the error descriptions provided.
The Transfer Status and Error Description columns clearly indicate whether the file transfer was completed successfully or encountered an issue (e.g., “File content download error” or “Execution error during OU file processing”).
🚀 Summary
The AllFunds File History page helps maintain operational integrity by giving clear visibility into the file exchange process with AllFunds.
It is a critical tool for troubleshooting, audit compliance, and ensuring that all relevant fund-related data is correctly sent and received.
By regularly reviewing this page, teams can proactively catch and resolve transfer issues to avoid downstream impacts on client accounts and reporting.
🔄 Booking Engine Integration
The Booking Engine Integration section is designed to monitor and manage the API-based communication between the Koala platform and the downstream (external) or upstream (internal) systems.
It allows users to track the lifecycle of booking requests and responses, analyze failures, and replay actions if needed.
This module is divided into two key monitoring pages:
- Downstream Queue Monitoring
- Upstream Queue Monitoring
Each of these focuses on one direction of data flow.
📥 Downstream Queue Monitoring
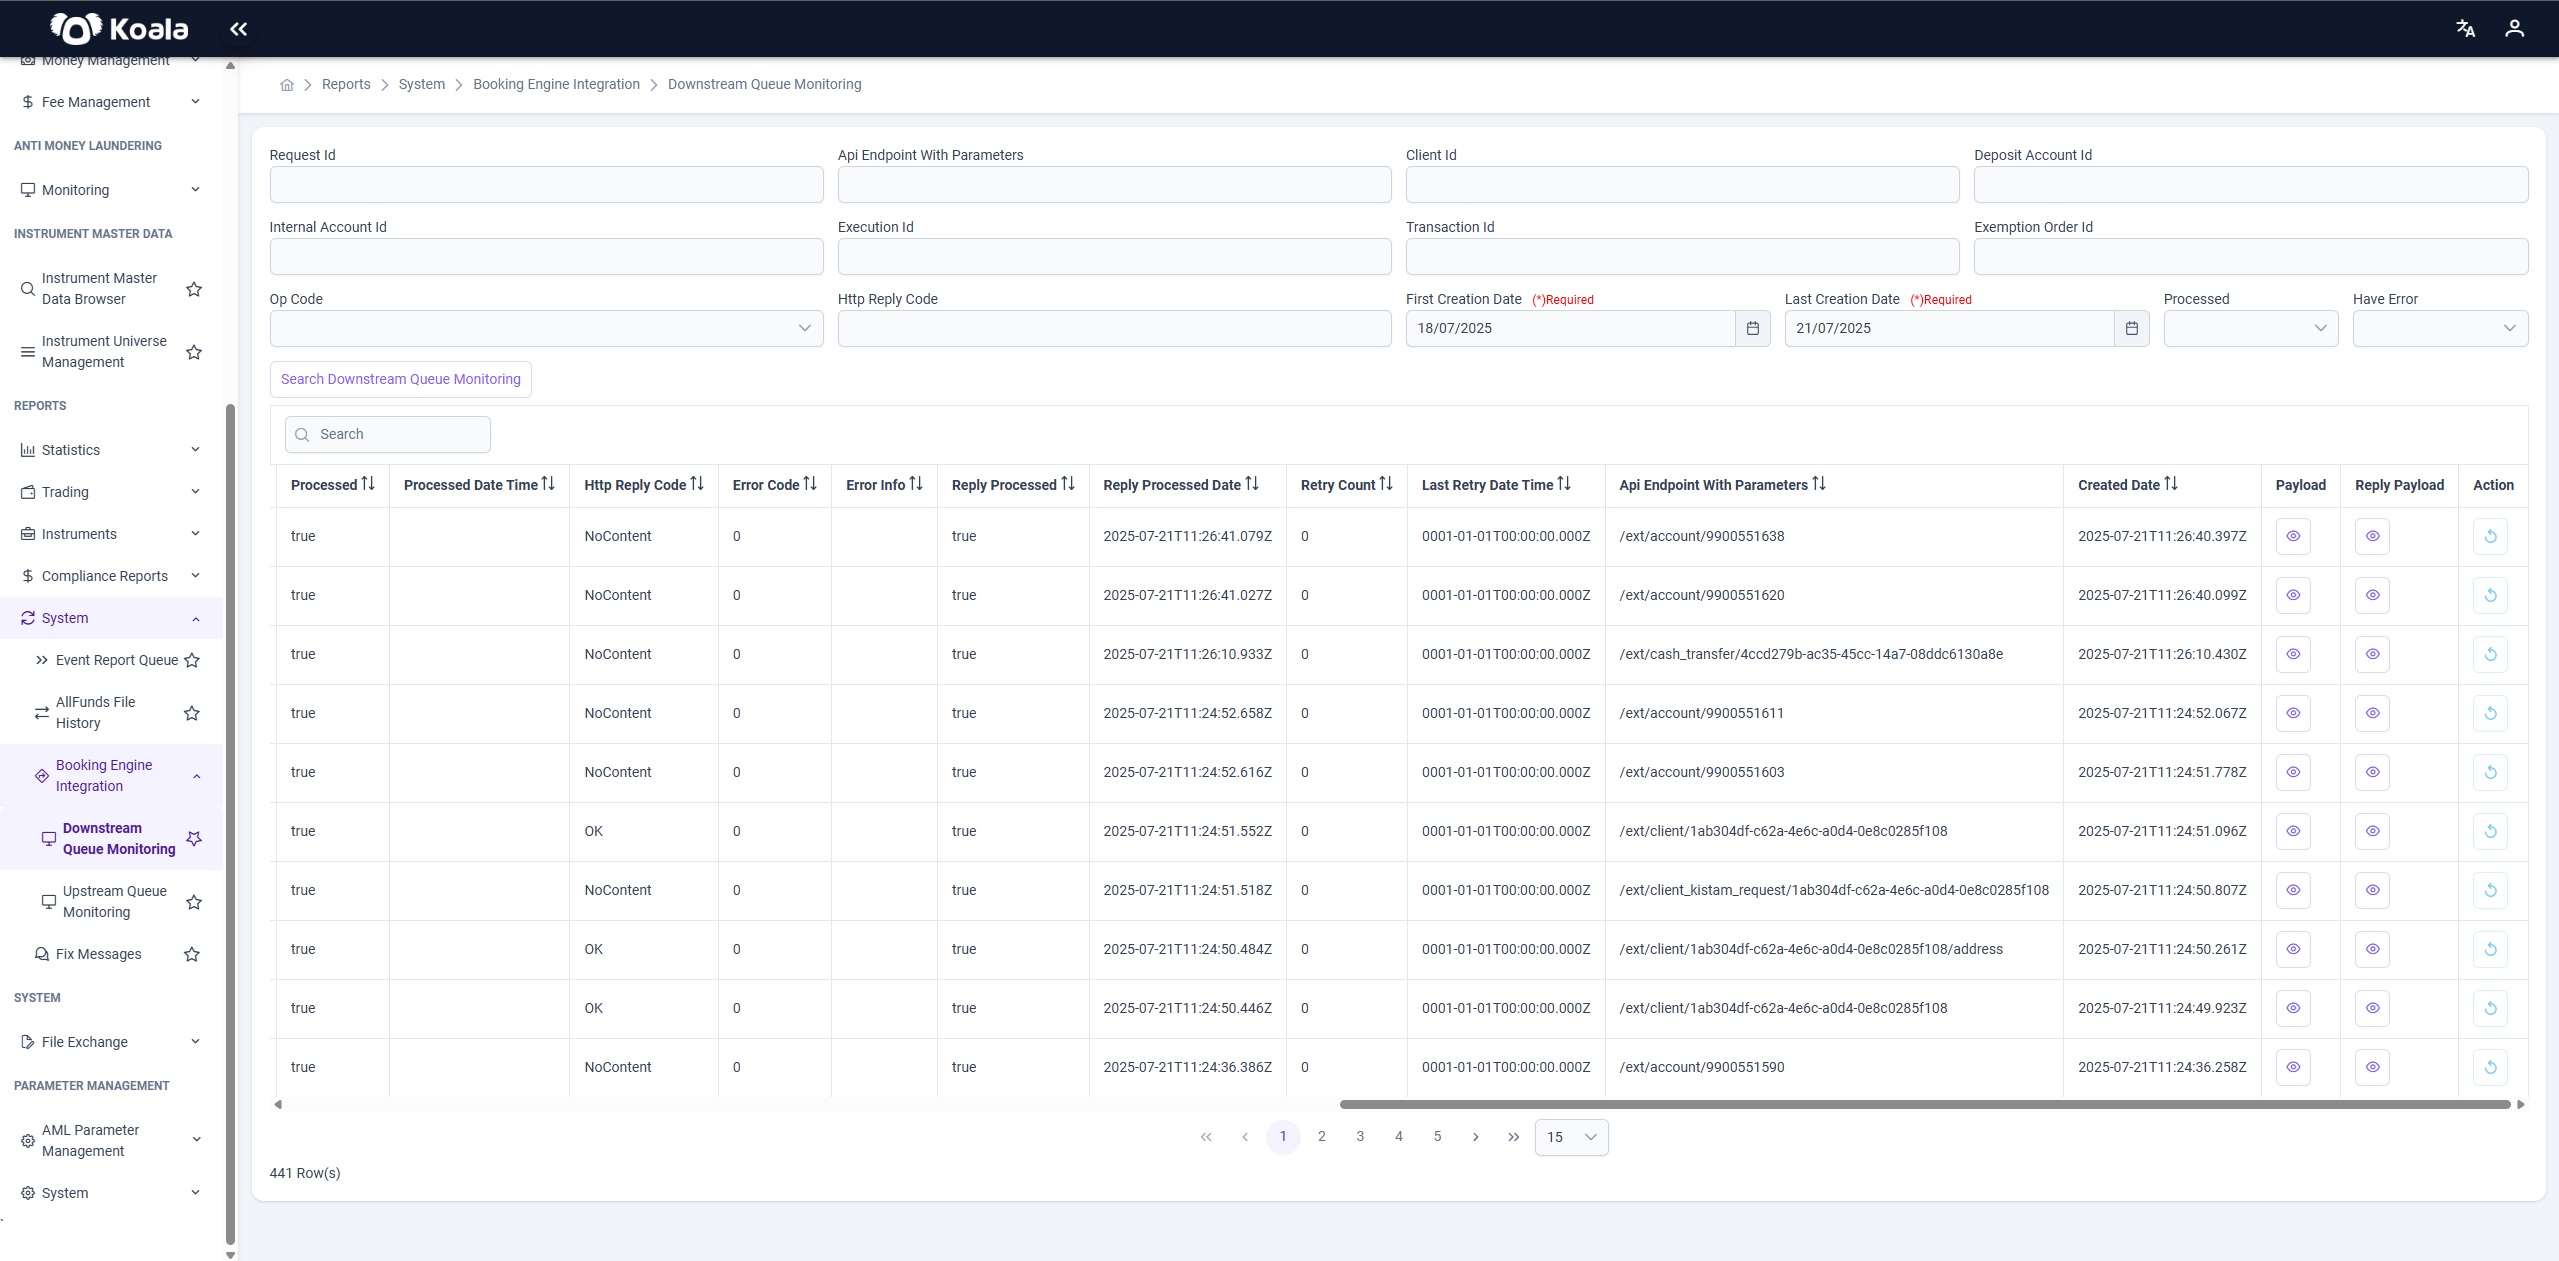
This page tracks requests sent from Koala to external downstream systems (e.g., clearing houses, custodians, etc.) via API.
It provides detailed visibility into the status of each request and response, making it easier to identify and resolve issues when communication with external systems fails or behaves unexpectedly.
🔎 Filters
The following filters are available to help you find specific records:
- Request Id
- API Endpoint With Parameters
- Client Id
- Deposit Account Id
- Internal Account Id
- Execution Id
- Transaction Id
- Exemption Order Id
- Op Code
- HTTP Reply Code
- First Creation Date (required)
- Last Creation Date (required)
- Processed
- Have Error
These filters let you narrow down the records to the exact API call or error you need to investigate.
📋 Table Overview
The results table displays each API request along with key metadata.
It includes:
- Identifiers and parameters of the request.
- Status of processing and whether an error occurred (
Have Error). - Error details (
Error Code,Error Info) when applicable. - Information about when and how often retries were attempted.
- Raw Payload (request) and Reply Payload (response) in JSON format for full transparency.
When a record has an error (Have Error is true), the Reply Action button becomes active.
This allows the user to manually trigger a replay of the failed API call to attempt successful processing again.
📤 Upstream Queue Monitoring
The Upstream Queue Monitoring screen is part of the Booking Engine Integration module and is used to track the upstream flow of transaction requests sent from the system to the core booking engine.
This report enables technical and operational users to monitor, investigate, and analyze each transaction request’s lifecycle, including whether it was processed successfully, failed with an error, or is still pending.
Filters and Parameters
At the top of the screen, you can apply the following filters to narrow down the results:
- Request Key: Unique identifier of the transaction request.
- Op Code: Operation code defining the type of transaction (e.g.,
CreateBookedTransactionRequest). - First Creation Date (Required): Starting date for request creation time.
- Last Creation Date (Required): Ending date for request creation time.
- Processed: Filter by whether the request has been processed (
trueorfalse). - Have Error: Allows filtering by whether the transaction request contains errors (
trueorfalse).
Clicking the Search button refreshes the table with records matching your filter selections.
Report Table
Each row in the table represents a single transaction request and includes the following columns:
- Client ID: Identifier for the client who initiated the transaction.
- Request Key: Unique reference for the transaction request.
- Op Code: The type of operation being executed (e.g.,
CreateBookedTransactionRequest). - Processed: Boolean indicating whether the request has been handled (
true) or not (false). - Processed Date Time: The timestamp of when the request was processed.
- Error Code: Numeric code indicating the type of error (if any).
- Error Info: Additional details related to the error.
- Created Date: Timestamp when the request was initially created in the system.
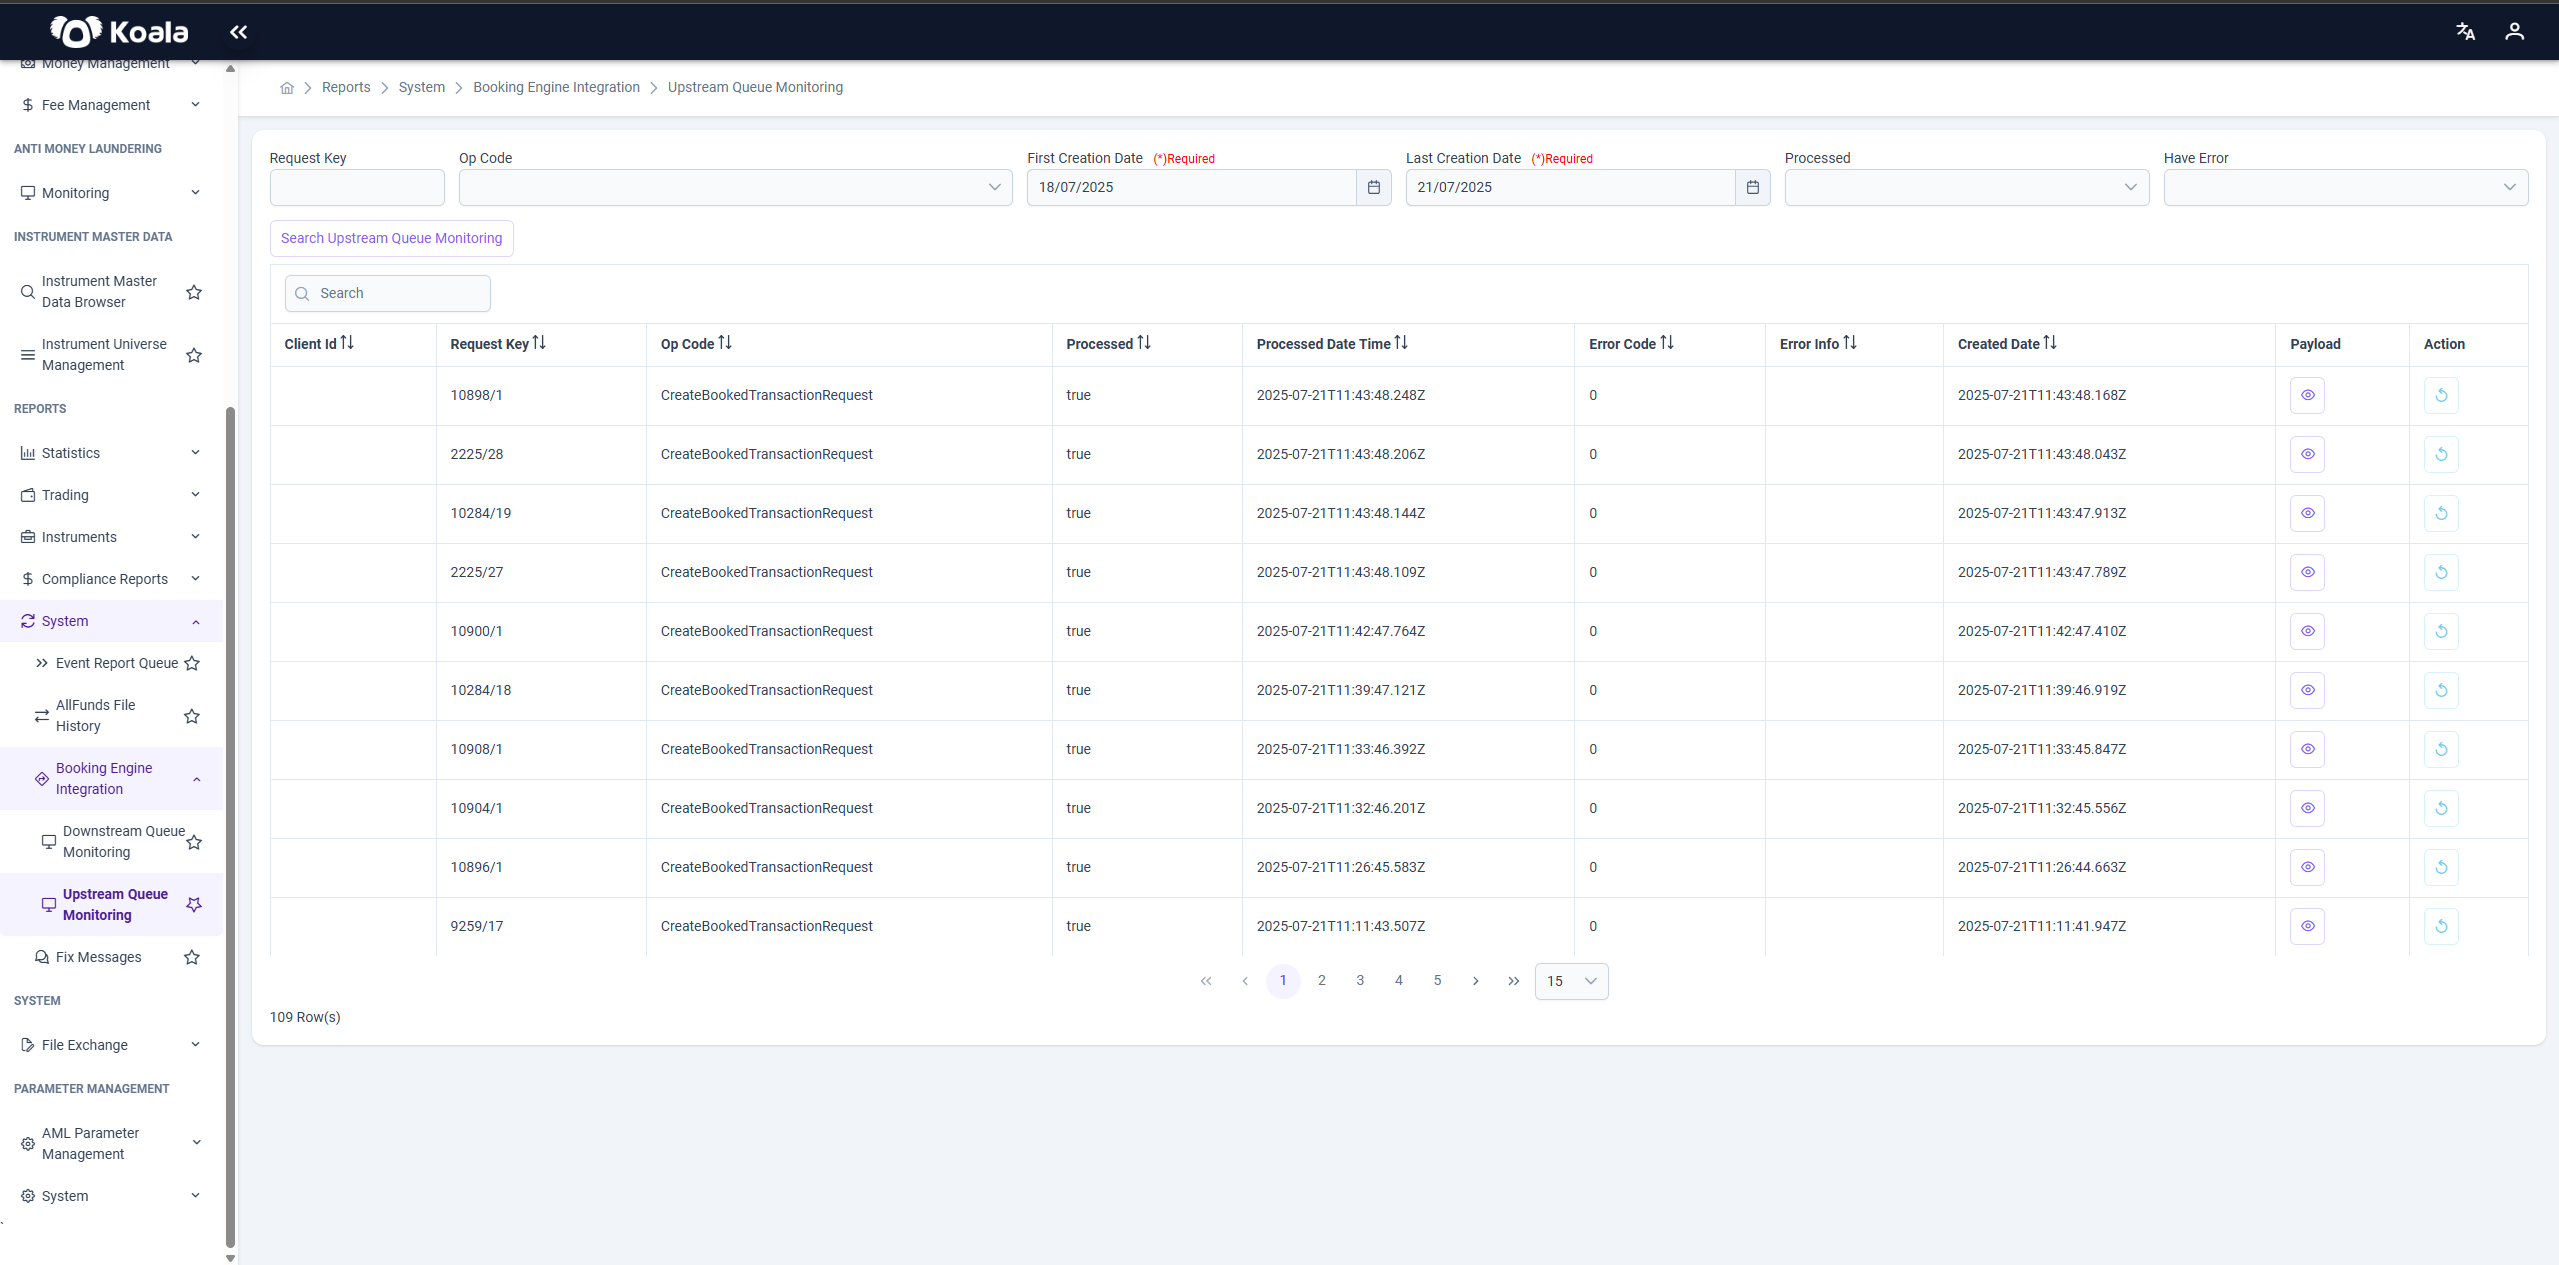
- Payload (🔍): Button to view the full payload content (e.g., JSON/XML).
- Action:
- If the transaction does not have an error, this field remains inactive or provides limited options.
- If the transaction has an error, users can use the Reply Upstream action to reinitiate the request to the upstream system.
This table allows the operations and support teams to track down failed or pending requests, analyze root causes, and take corrective actions using built-in tools such as retry and payload inspection.
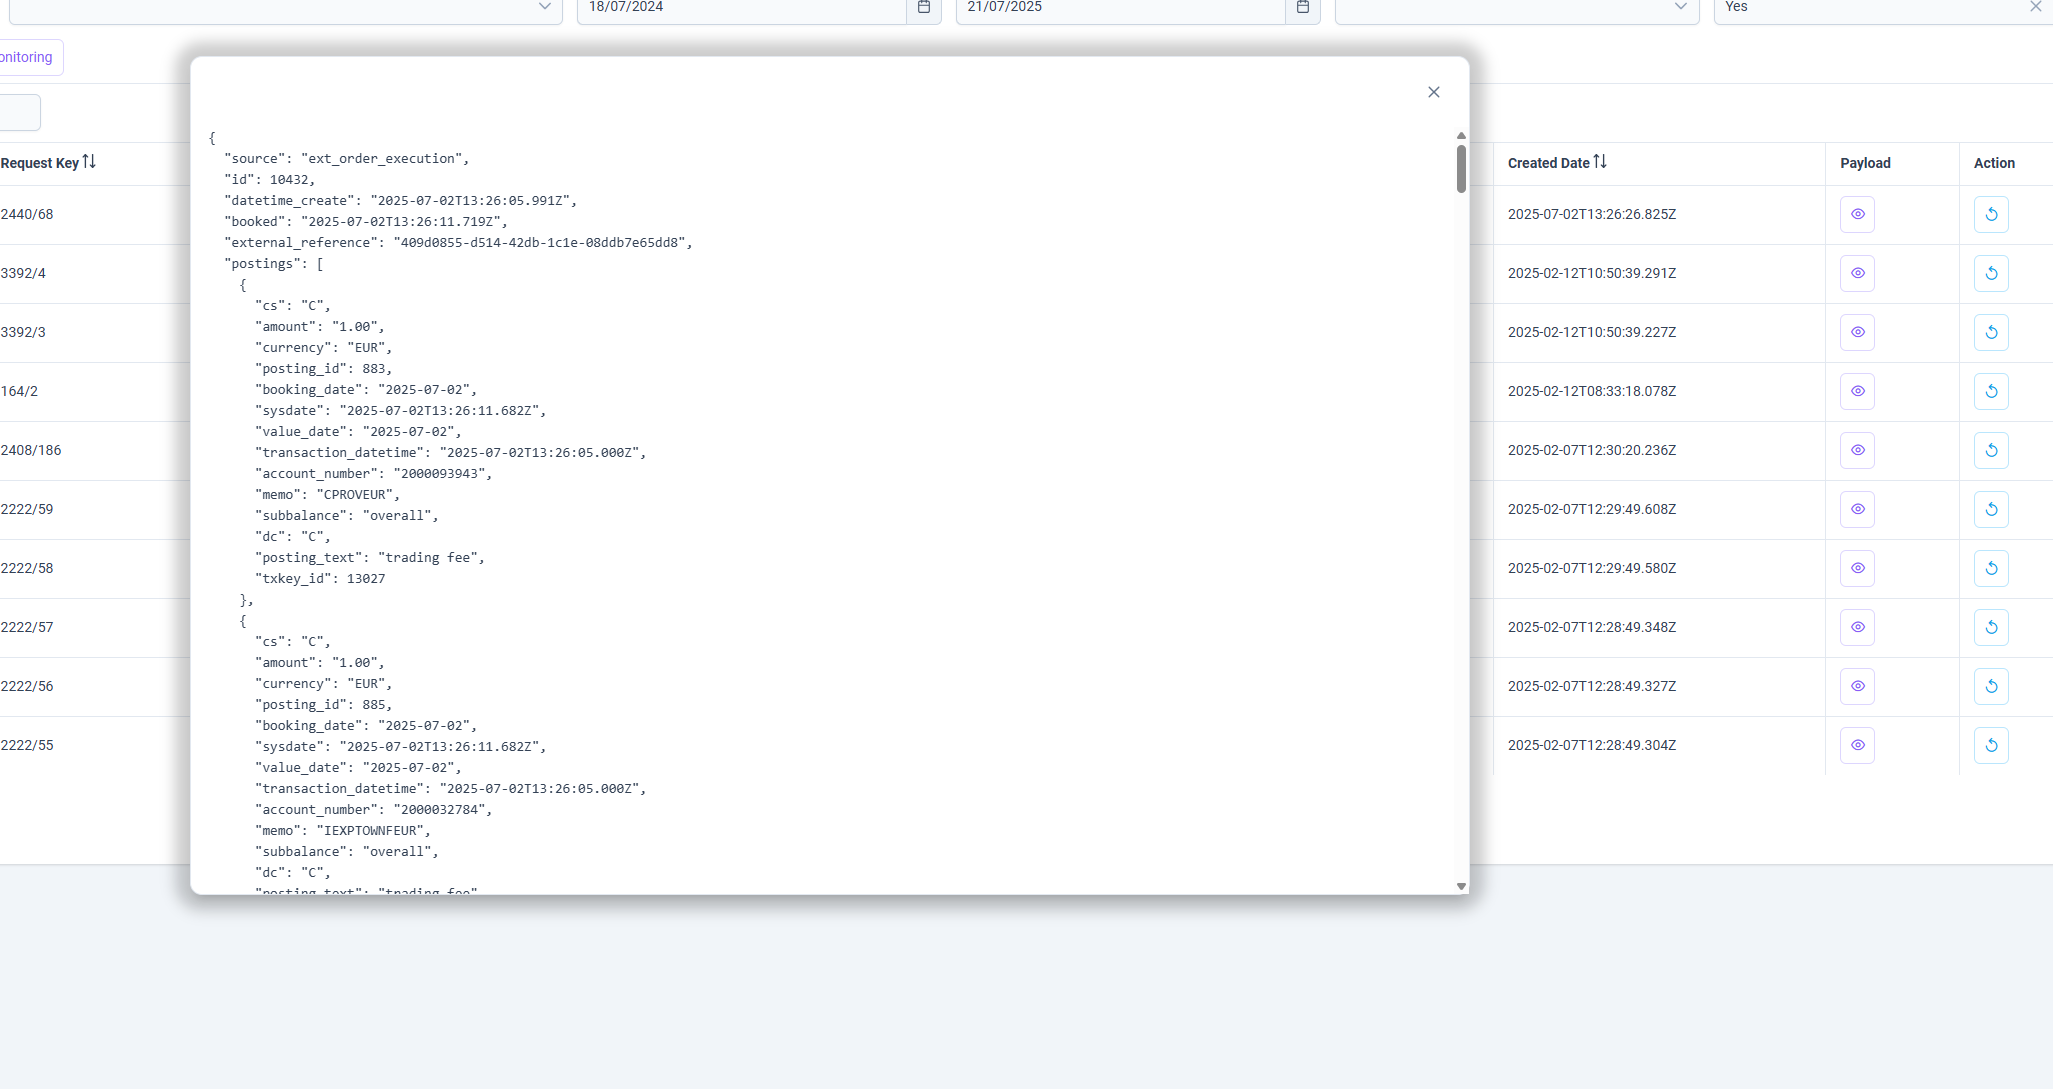
ℹ️ This screen is essential for real-time transaction monitoring, debugging system-to-engine communication, and ensuring message delivery integrity.
🚀 Summary
The Booking Engine Integration module ensures reliable, auditable, and recoverable communication between Koala and other systems.
It gives operations and support teams powerful tools to monitor API flows, diagnose issues, and take corrective actions promptly.
- Downstream Queue Monitoring: Outbound requests from Koala to external systems.
- Upstream Queue Monitoring: Inbound requests received by Koala from external/internal systems.
- Both pages offer advanced filtering, raw JSON inspection, error details, and replay functionality for failed transactions.
💬 Fix Messages
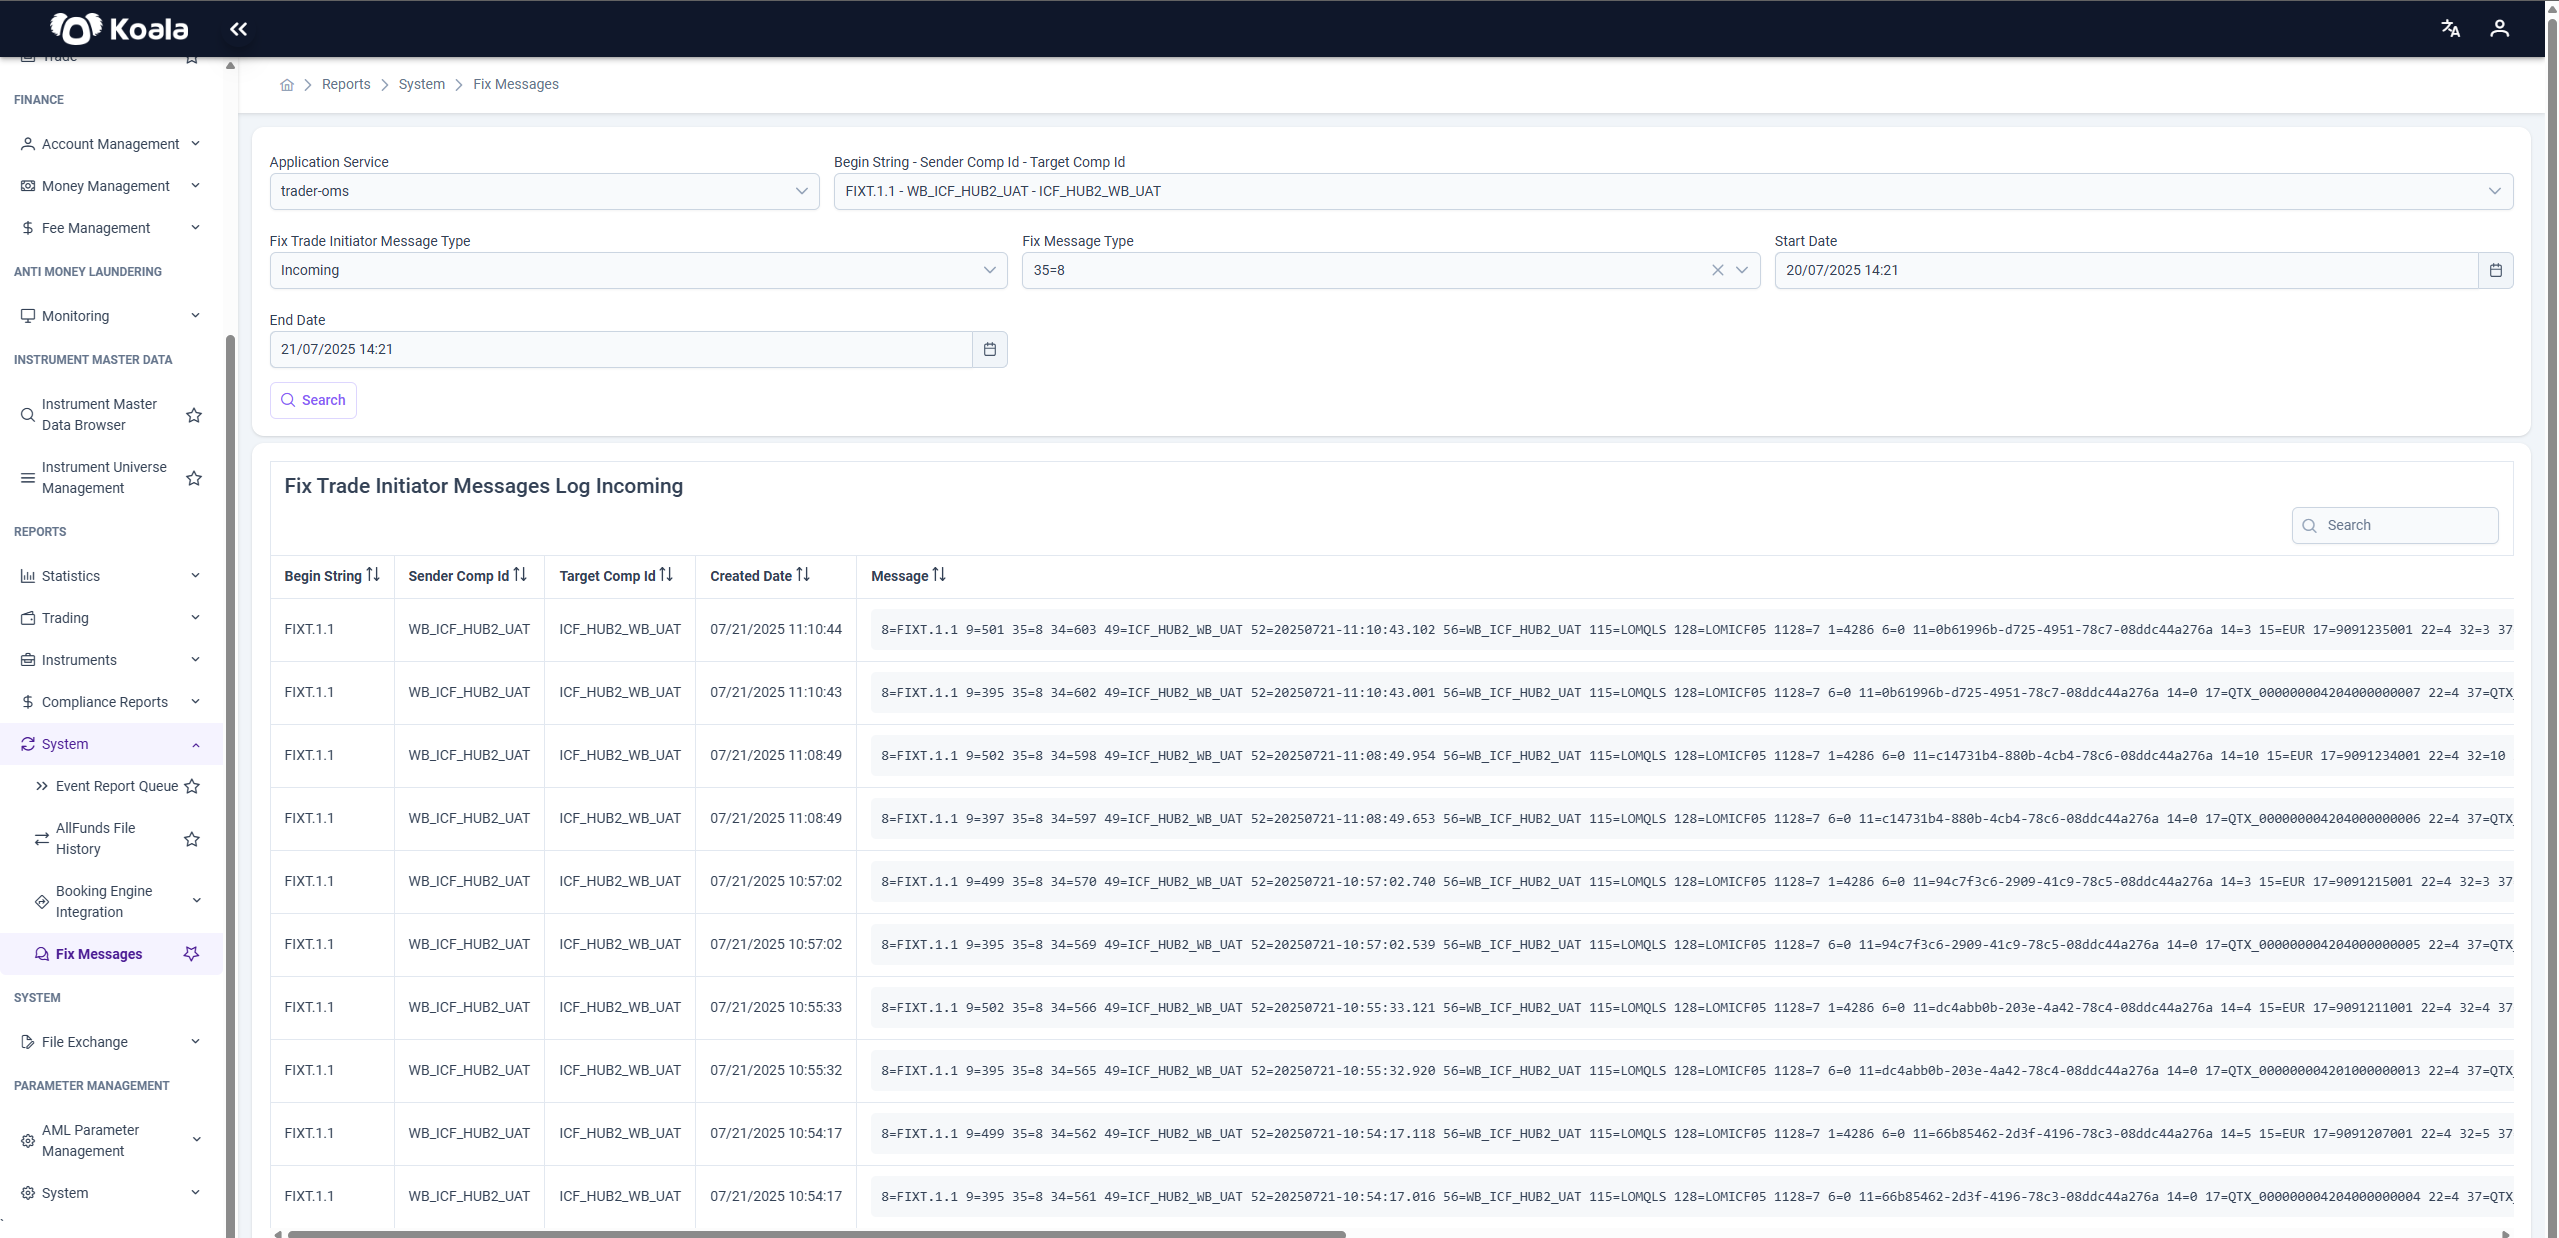
The Fix Messages page is a monitoring and troubleshooting interface for the FIX (Financial Information Exchange) protocol messages exchanged between the Koala platform and external trading or market systems.
The FIX protocol is a standard for real-time electronic exchange of securities transactions.
This page allows operations and technical teams to:
- Track incoming and outgoing FIX messages.
- Monitor their content for auditing or debugging purposes.
- Investigate issues or anomalies in trade communication.
🧭 Page Overview
At the top, a filter & search panel is provided to narrow down the log records by:
- Application Service: The relevant service (e.g.,
trader-oms) sending or receiving the message. - Begin String - Sender Comp Id - Target Comp Id: FIX session identifiers (protocol version, sender and target IDs).
- Fix Trade Initiator Message Type: Direction of message (
IncomingorOutgoing). - Fix Message Type: Specific FIX message type (e.g.,
35=8for Execution Report). - Start Date / End Date: The time range for the message logs.
Once the criteria are set and Search is clicked, the results table is populated.
📋 Table Columns
| Column | Description |
|---|---|
| Begin String | FIX protocol version used (e.g., FIXT.1.1) |
| Sender Comp Id | The sender company or system identifier |
| Target Comp Id | The receiving company or system identifier |
| Created Date | The timestamp when the message was logged |
| Message | Full raw content of the FIX message |
🔎 Usage & Purpose
The Fix Messages page is a critical tool for:
- Auditing FIX session activity.
- Verifying that messages are sent/received correctly and completely.
- Troubleshooting message-related problems by inspecting the raw message data.
By analyzing the Message column, teams can decode the FIX tags and values to understand the details of each transaction, acknowledgement, or rejection.
Typically, the operations or technical support teams use this page when:
- Investigating missing or failed trades.
- Monitoring latency and sequencing issues.
- Confirming that specific trades have been executed and acknowledged properly.
🚀 Summary
The Fix Messages page provides full transparency into the FIX-level communication between Koala and counterparties.
It enables timely identification of issues, facilitates compliance with audit requirements, and supports operational stability by ensuring the integrity of trade communications.
📑 IFR Report
The IFR Report page is a regulatory and analytical reporting screen designed to provide a consolidated financial overview of the institution over a selected time period.
It supports monthly-based analysis, trend monitoring, and regulatory reporting requirements.
🎯 Purpose of IFR Report
The IFR (Investment Firm Regulation) is used to:
- Monitor key financial metrics over time
- Support internal risk, liquidity, and exposure analysis
- Provide structured data for regulatory or supervisory reporting
- Analyze client money, asset coverage, trading flows, and risk positions
The report allows users to compare financial figures across months and review historical trends within a defined date range.
📅 Date Range Selection
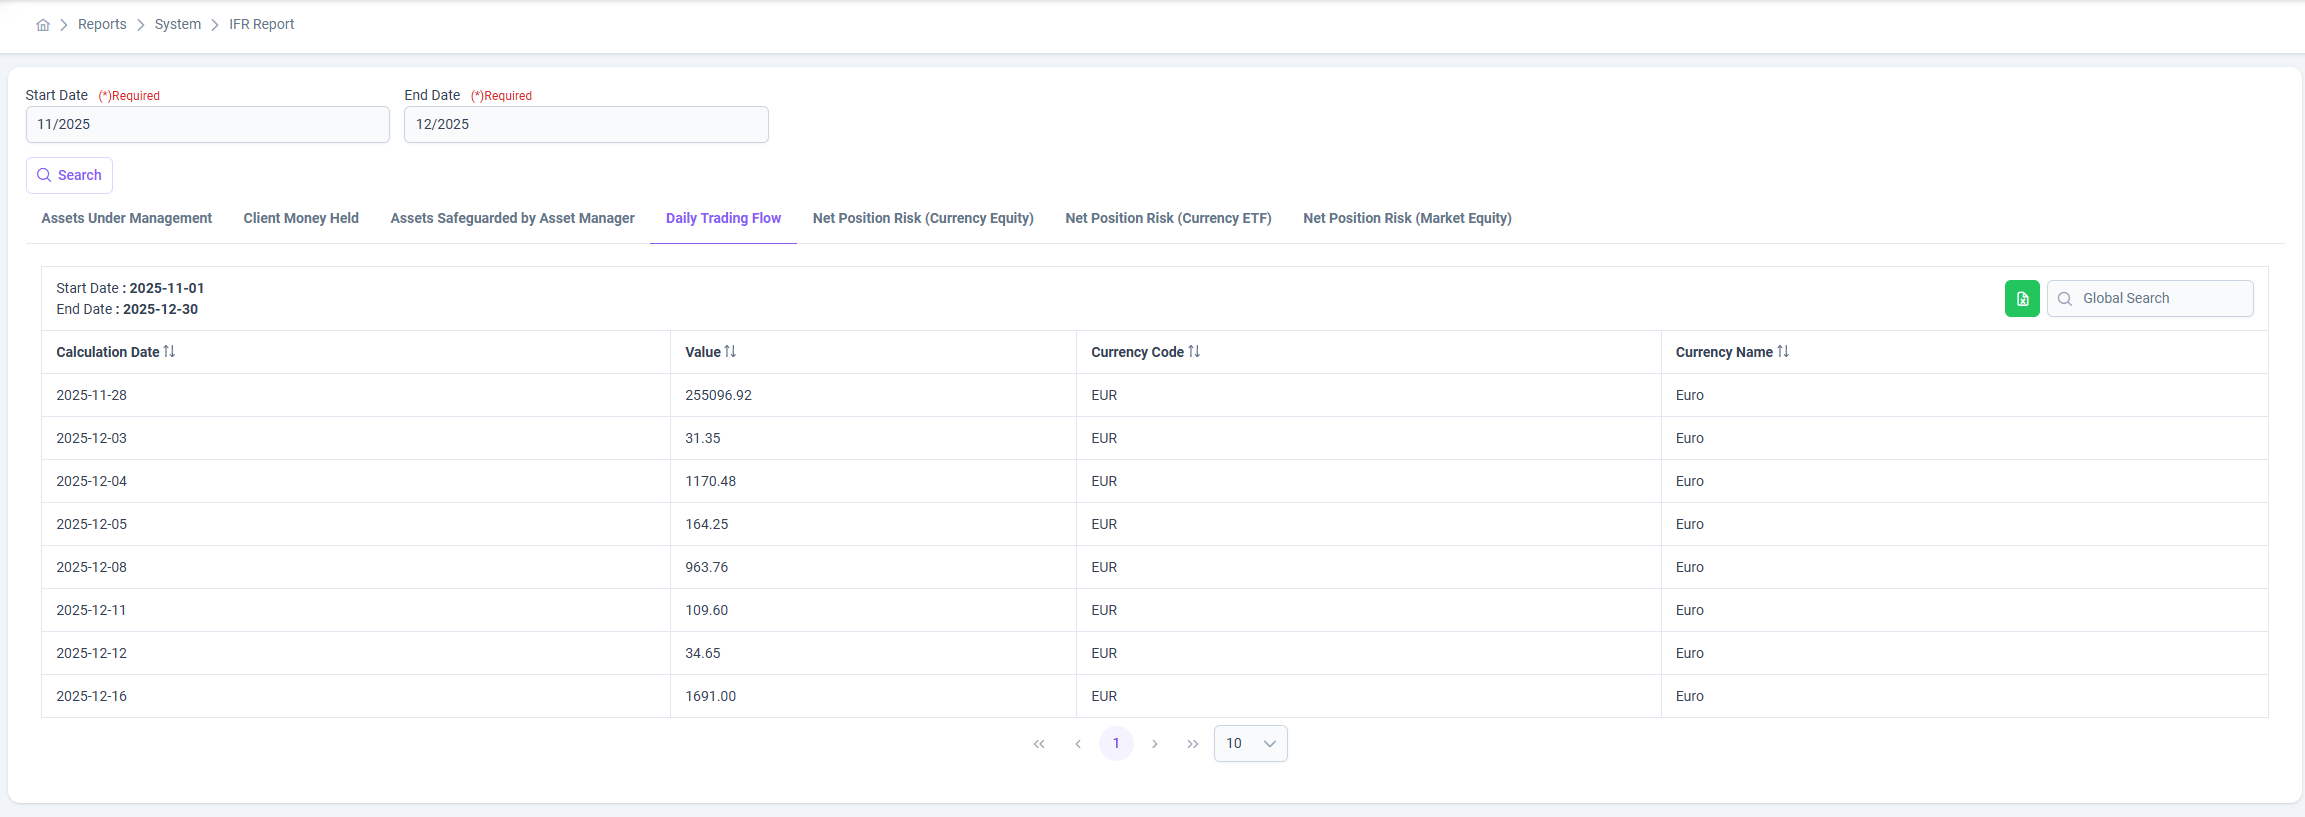
At the top of the page, users must define a reporting period:
- Start Date (Required)
- End Date (Required)
📌 The report supports month-based searching, allowing users to:
- Analyze data between specific months
- Compare financial movements across reporting periods
- Generate consistent monthly snapshots
After selecting the date range, clicking Search loads the report data.
🧭 Report Tabs Overview
The IFR Report is organized into multiple tabs, each representing a specific financial dimension:
1️⃣ Assets Under Management (AUM)
Displays the total value of assets managed on behalf of clients.
- Used to monitor overall portfolio size
- Key indicator of business scale and growth
2️⃣ Client Money Held
Shows the total amount of client funds held by the institution.
- Supports segregation and safeguarding requirements
- Helps track client cash balances over time
3️⃣ Assets Safeguarded by Asset Manager
Represents assets that are safeguarded or held via third-party asset managers.
- Ensures visibility into custody and safekeeping arrangements
- Supports regulatory asset protection reporting
4️⃣ Daily Trading Flow
Displays aggregated daily trading volumes within the selected period.
- Helps analyze trading activity trends
- Useful for operational and liquidity monitoring
Columns typically include:
- Calculation Date
- Value
- Currency Code
- Currency Name
5️⃣ Net Position Risk (Currency Equity)
Shows net risk exposure by currency for equity instruments.
- Used to monitor FX-related equity risk
- Supports risk management and capital adequacy analysis
6️⃣ Net Position Risk (Currency ETF)
Displays currency-based risk exposure related to ETFs.
- Helps track diversified and exchange-traded product exposure
- Important for portfolio risk assessment
7️⃣ Net Position Risk (Market Equity)
Provides market-level equity risk exposure.
- Focuses on equity market concentration
- Supports market risk monitoring and reporting
📊 Data Table & Navigation
Each tab presents data in a structured table format:
- Sortable columns
- Pagination support
- Global search for quick filtering
- Currency-aware reporting (Code & Name)
This ensures clear visibility and easy comparison of financial values across dates.
✅ Key Benefits
- Centralized financial reporting
- Month-to-month comparison capability
- Regulatory and internal reporting readiness
- Clear separation of financial metrics via tabs
- Supports risk, liquidity, and asset oversight functions
📝 Summary
The IFR Report page provides a comprehensive, tab-based financial reporting framework that enables institutions to:
- Analyze financial performance over time
- Monitor risk and exposure
- Support compliance and regulatory reporting
- Make informed operational and strategic decisions